Module 3: Windows Event Logs & Finding Evil
This module is about using Windows logs to find suspicious activity. I kept the Skill Assessment separate because it is much more command-heavy. This page is the main Module 3 notes page, with the same images and same technical points from my draft, just organized into a cleaner blog structure.
Module 3 Navigation
On this page
- Windows Event Logs
- XML Filtering and Correlation
- Sysmon
- Detection Scenario A: DLL Hijacking
- Detection Scenario B: Unmanaged PowerShell
- Detection Scenario C: Credential Dumping
- ETW: Event Tracing for Windows
- Practical ETW Hunting with SilkETW
- Get-WinEvent Notes
- Where AI Can Help
- References
- Skill Assessment
Skill Assessment
Reusable PowerShell detectors and XML first-pass queries: HTB-CDSA on GitHub
Windows Event Logs
Windows Event Logs are one of the most important artifacts from a Windows operating system. They are crucial for intrusion detection and diagnostic analysis, but they can also get overwhelming because of the amount of logs a system might generate.
The default Windows logs include:
| Log | What It Covers |
|---|---|
| Application | Application errors, warnings, and operational events. |
| Security | Authentication, account activity, privilege use, and audited security activity. |
| Setup | Installation and setup activity. |
| System | Services, drivers, hardware, and operating system activity. |
| Forwarded Events | Events centrally collected from other machines. |
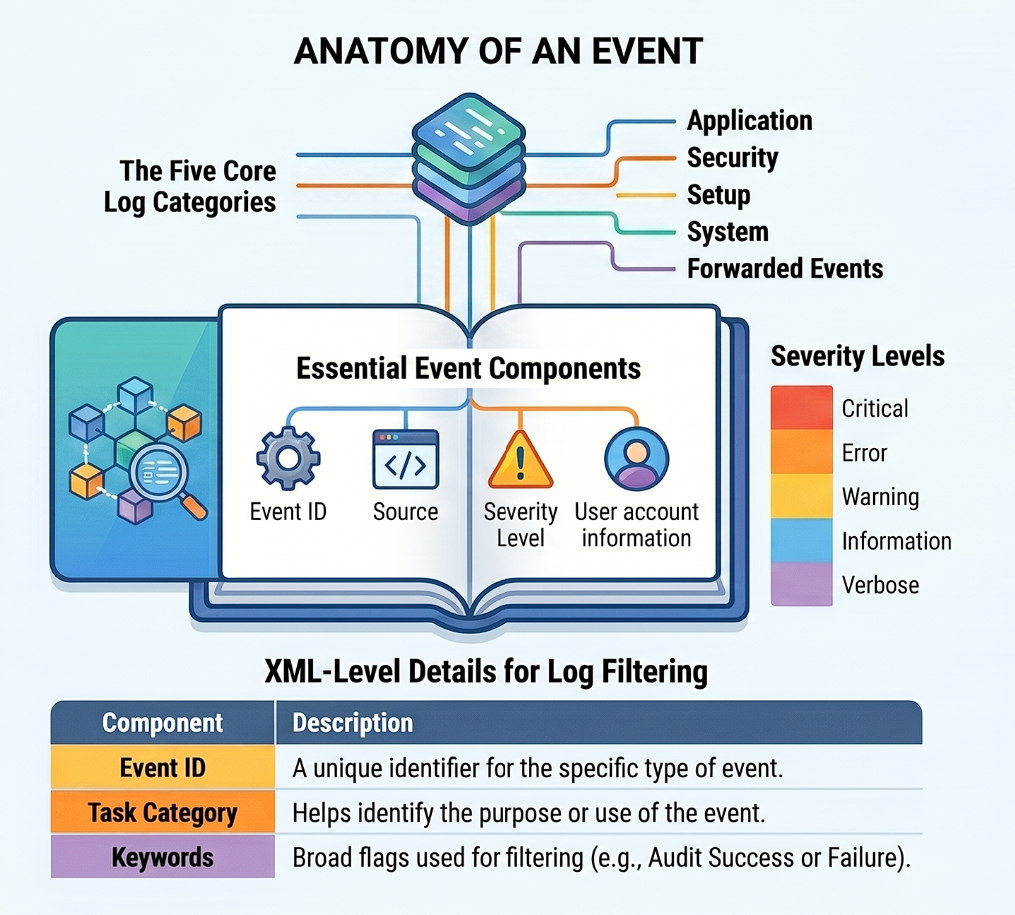
Windows Event Log anatomy showing the five core log categories, essential event components, severity levels, and XML-level filter fields.
XML Filtering and Correlation
Filtering with XML is very useful when you want to sort for specific fields. For example, it can help correlate multiple events back to a specific user session and build a timeline of activity.
It is also very important to understand what is normal in the network. That helps reduce false positives. Log centralization also matters because it allows logs to be collected, parsed, correlated, and alerted on in real time. This connects directly to what the previous SIEM module covered.
Key security Event IDs are important to keep in mind, but the real conclusion usually comes from correlation.
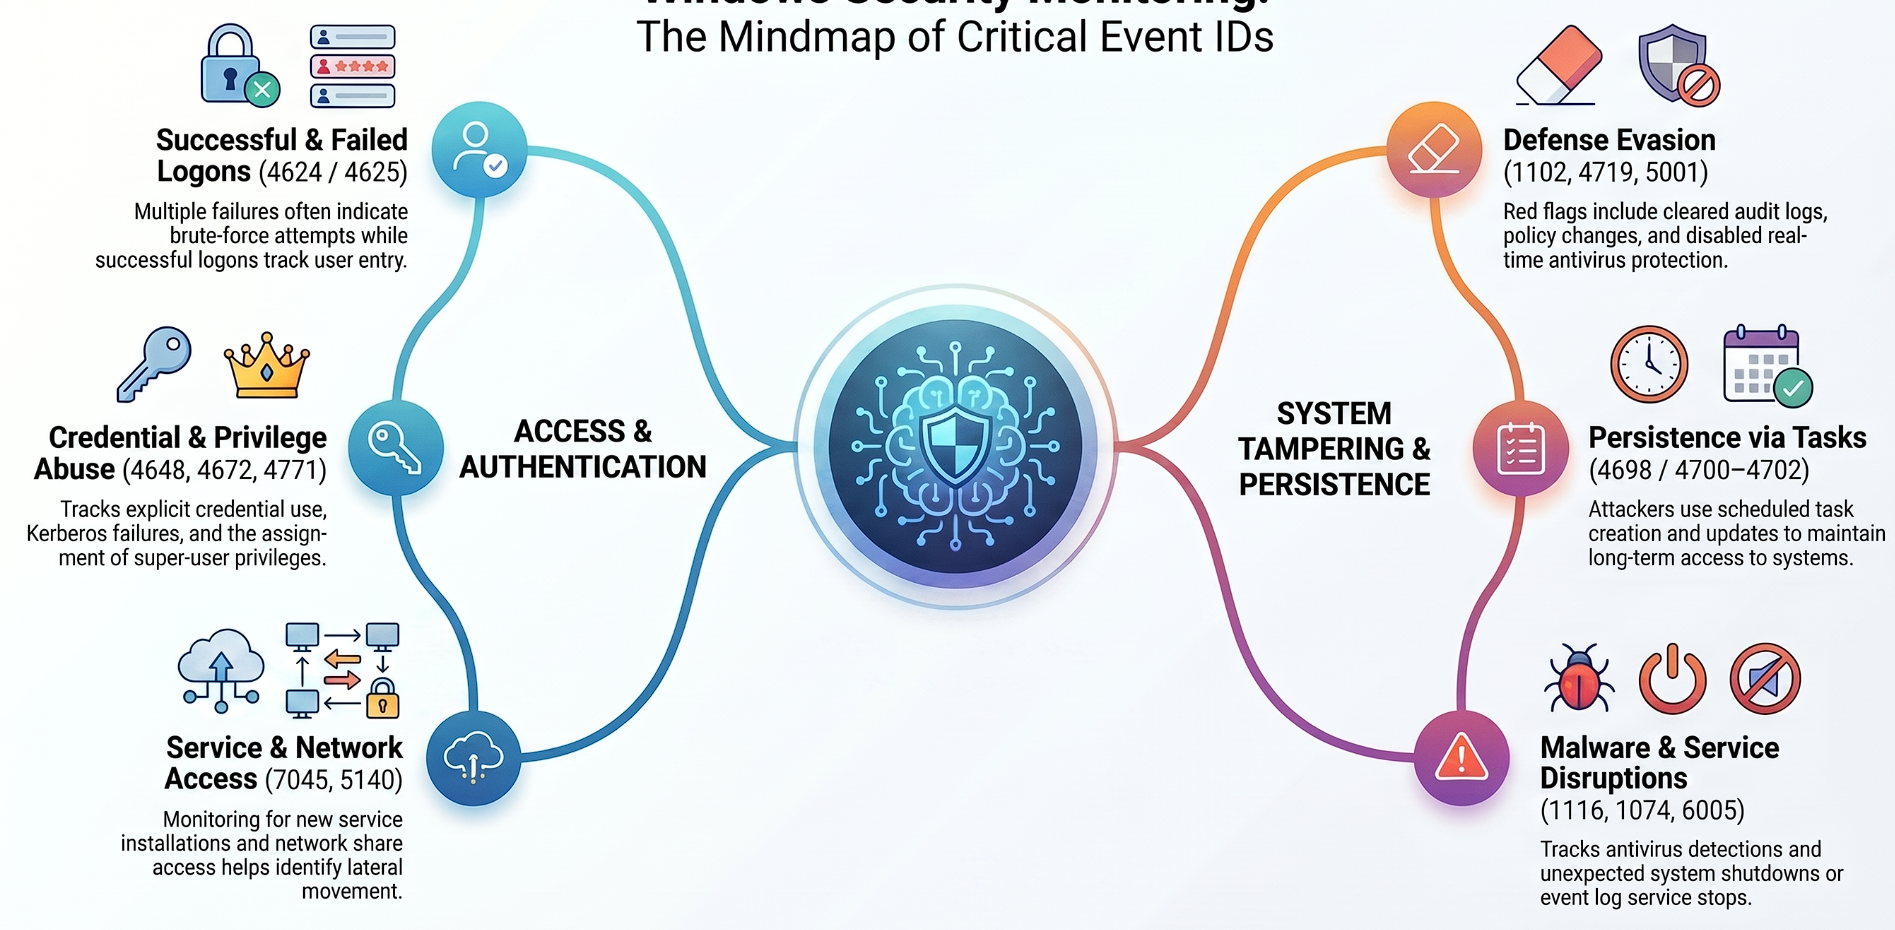
Mind map of critical Windows Security Event IDs for XML filtering and correlation, split between access/authentication and system tampering/persistence.
Sysmon
Then comes Sysmon.
Sysmon is a Windows system service and device driver that remains active across system reboots. It provides deep forensic visibility by logging system activity that typically does not appear in standard Security Event logs.

Meme reference from the module (not a technical diagram).
Sysmon uses an XML-based configuration file to filter which events to include or exclude, for example based on process names or IP addresses. Popular configurations include SwiftOnSecurity’s Sysmon config, which I also used while working on labs.
Log Location: Once configured and running, Sysmon events can be viewed in Event Viewer under:
Applications and Services -> Microsoft -> Windows -> Sysmon
Sysmon has different Event IDs.
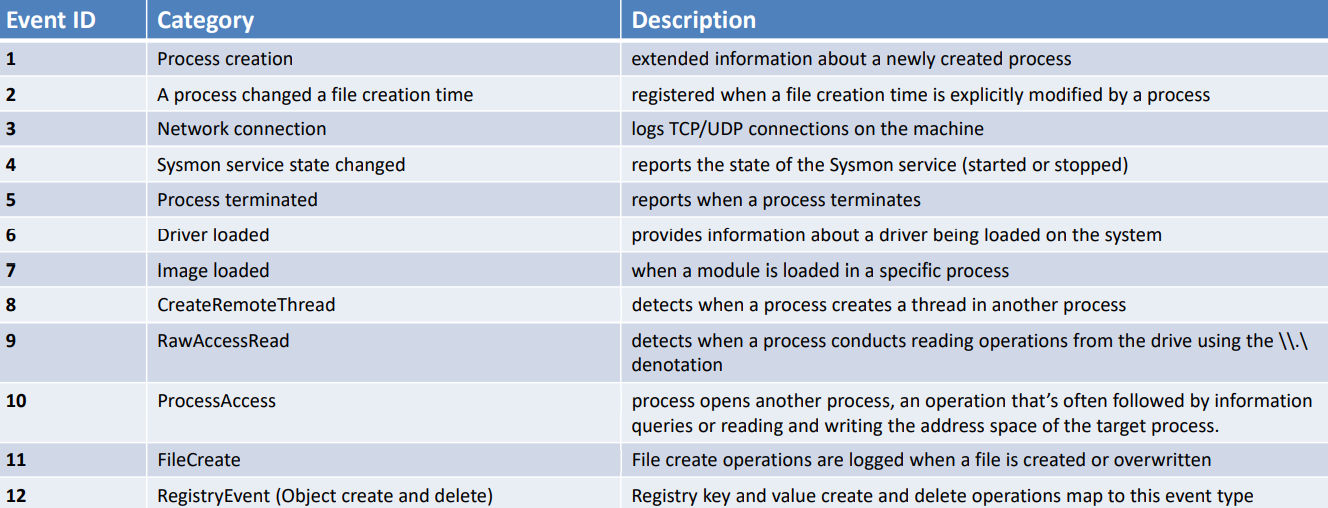
Reference: Sysmon Event IDs 1-12 with category and description (see References - Microsoft Sysmon / Cyberdom).
In this module, the main Sysmon Event IDs discussed were 1, 3, 7, and 10. The module then used those Event IDs across different detection scenarios where Sysmon can help.
| Sysmon Event ID | Detection Value |
|---|---|
1 |
Process creation, parent-child relationships, command line, user context. |
3 |
Network connections. |
7 |
Image or module loaded, useful for DLL hijacking and CLR-related detection. |
10 |
Process access, useful for LSASS access and credential dumping detection. |
Detection Scenario A: DLL Hijacking and Injection
This section incorporates different types of DLL hijacking and injection to give a more complete overview for my notes.
Context
At its core, DLL hijacking is a technique where an attacker tricks a trusted, legitimate application into loading a malicious DLL instead of the one it actually needs. Attackers use this for stealthy execution, persistence, and privilege escalation.
While people often use terms like “DLL Injection,” “DLL Spoofing,” and “DLL Side-Loading” interchangeably, DLL Hijacking works well as the umbrella term when a malicious DLL takes over from a legitimate one.
Different Types of DLL Hijacking and Injection
Depending on how an application is configured to load its required files, attackers can choose from a variety of injection and hijacking approaches.
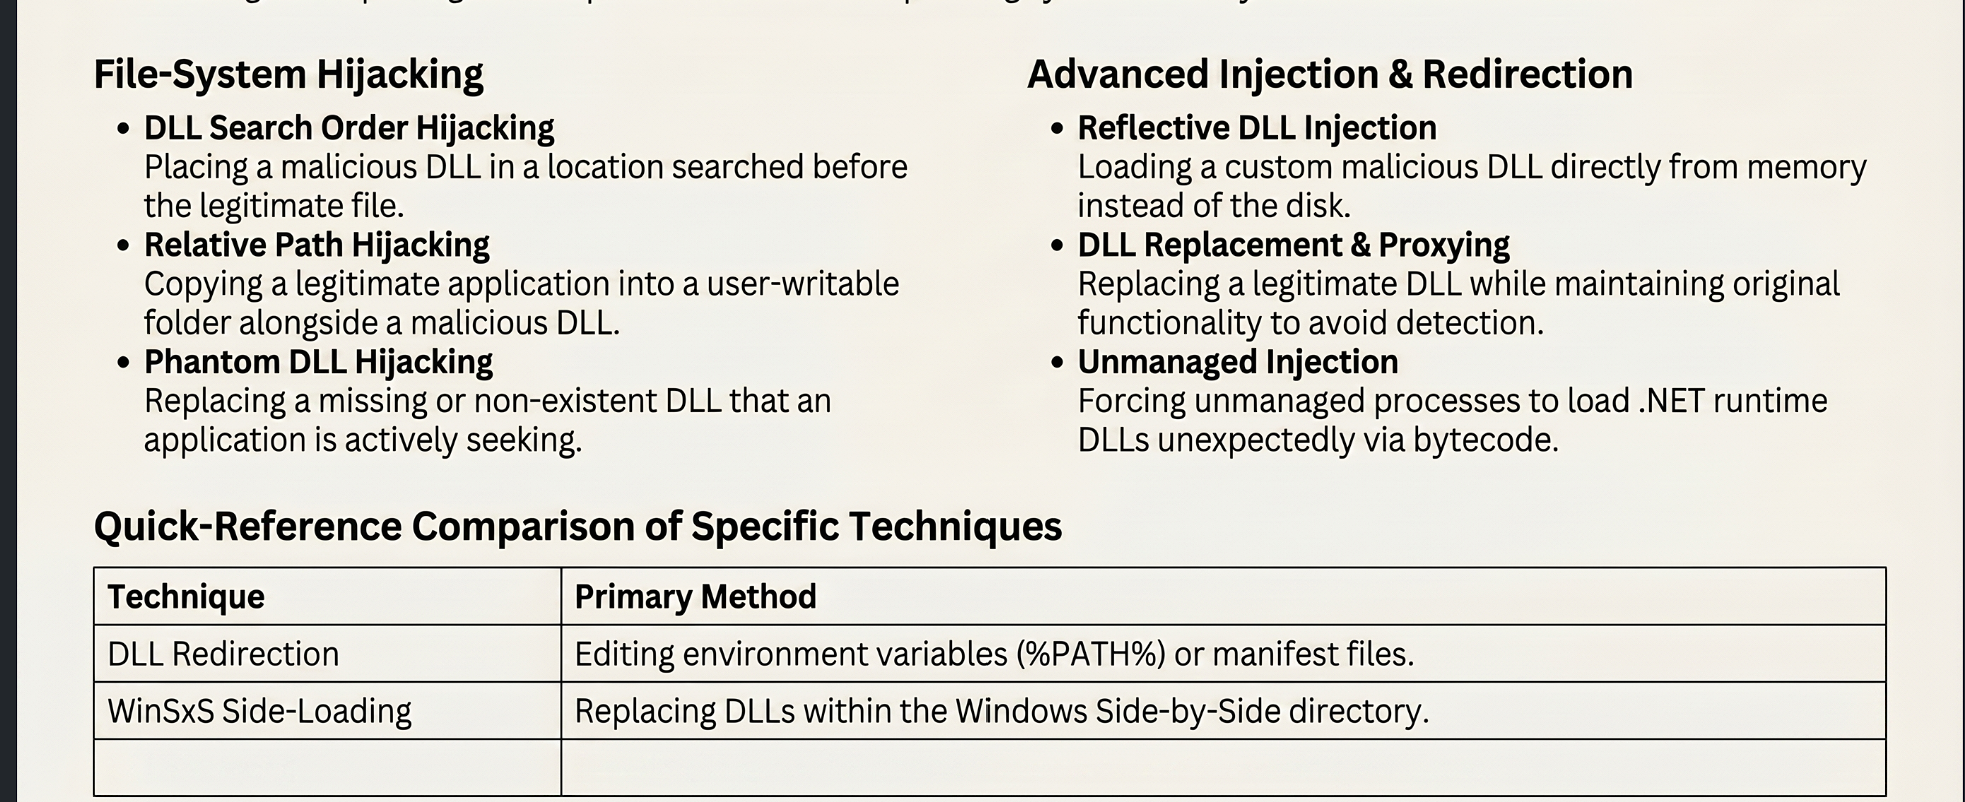
Reference: DLL hijacking and injection techniques (see References - Wietze Beukema).
Indicators of Compromise to Monitor
By monitoring Sysmon Event ID 7 (Image / Module Loaded), defenders can spot signs of injection and hijacking regardless of which specific executable is being exploited.
| Indicator | Why It Matters |
|---|---|
| Unexpected Executable Location | A legitimate system binary, such as calc.exe or winsat.exe, is seen executing from a writable or temporary directory like Desktop, %appdata%, or another user-writable path instead of C:\Windows\System32 or Syswow64. |
| Suspicious DLL Path | A standard system DLL, such as WININET.dll, is loaded from outside its official system directory. |
| Unsigned Code | The injected or malicious DLL appears as unsigned or falsely signed, while the legitimate counterpart should be Microsoft-signed. |
| Mocked Directories (UAC Bypass Flag) | Attackers may place the executable and malicious DLL in a mocked trusted directory such as C:\Windows \System32\, with a suspicious trailing space. Folder creation or execution involving trailing spaces is rare and a major red flag. |
Detection Scenario B: Unmanaged PowerShell / C# Injection
C# is a “managed” language, meaning it relies on the Common Language Runtime (CLR) to process its bytecode. Standard Windows processes, like the print spooler spoolsv.exe, are “unmanaged” and do not use the CLR.
The Attack
Attackers inject unmanaged PowerShell or C# bytecode into an unmanaged process.
Indicators of Compromise
You will see a sudden transition of a process from an unmanaged to a managed state. Using Event ID 7 or tools like Process Hacker, look for unexpected loading of Microsoft .NET Runtime components into processes that typically never require them.
| DLL | Why It Matters |
|---|---|
clr.dll |
The .NET Common Language Runtime. |
clrjit.dll |
The .NET JIT compiler. |
It is also worth noting that a legitimate .NET application loads clr.dll within milliseconds of starting. If a process has been running for 60+ seconds and suddenly loads clr.dll, that is injection behavior, not normal startup.
Detection Scenario C: Credential Dumping / Mimikatz
Attackers read LSASS memory to extract credentials. Sysmon Event ID 10 logs every time one process opens a handle to another, making it the primary detection point.
The Four IOCs, in Order of Confidence
| IOC | What to Check | Why It Matters |
|---|---|---|
| GrantedAccess mask | 0x1010, 0x1fffff, 0x1410, 0x143a |
These indicate memory reading, full process access, or common dumper variants. |
| SourceImage path | Process accessing LSASS from C:\Users\, C:\Temp\, or C:\Downloads\ |
Legitimate processes that access LSASS normally live in C:\Windows\System32\. |
| SourceUser vs TargetUser mismatch | A standard user opening a high-privilege handle to LSASS | LSASS runs as NT AUTHORITY\SYSTEM, so this is abnormal when combined with high access. |
| UNKNOWN in CallTrace | UNKNOWN(address) entries |
This suggests the access came from memory with no associated module, such as shellcode or reflectively loaded code. |
GrantedAccess examples:
| GrantedAccess | Meaning |
|---|---|
0x1010 |
Mimikatz signature, VM_READ + QUERY_LIMITED. |
0x1fffff |
Full access, often seen with Process Hacker or custom dumpers. |
0x1410, 0x143a |
Common dumper variants. |
0x1000 |
Normal limited query access. Anything higher needs investigation and correlation. |
The important reminder here is that detection should be agnostic. Do not anchor only on process names. LSASS itself can be renamed, and dumping tools can be renamed too. GrantedAccess, path, user mismatch, and CallTrace anomalies are harder to hide.
ETW: Event Tracing for Windows
Another section was ETW.
According to Microsoft, ETW is a general-purpose, high-speed tracing facility built deep within the Windows operating system. It relies on a buffering and logging mechanism implemented directly in the kernel to trace events generated by both user-mode applications and kernel-mode device drivers.
Why Use ETW?
In threat detection, relying only on standard log data can fall short. ETW captures a wide range of telemetry sources, such as system calls, network activity, process creation and termination, and file or registry modifications. This provides much deeper system activity.
Performance
ETW is designed to be lightweight with minimal performance impact, making it useful for real-time monitoring. To prevent system resource exhaustion, many high-volume event providers are disabled by default and only activate when a tracing session specifically requests them.
ETW Architecture
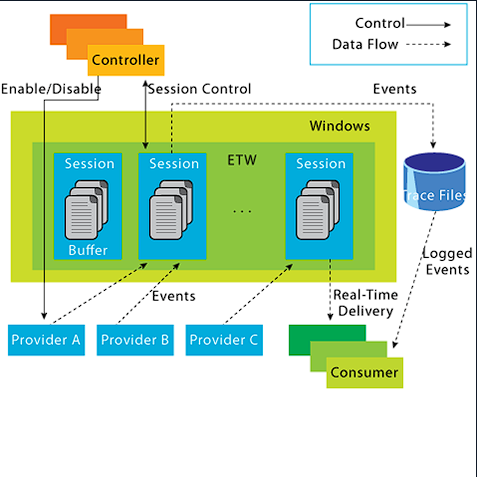
ETW publish-subscribe architecture: Controllers, Providers, Sessions, Consumers, and Trace Files.
| Component | Role |
|---|---|
| Controllers | Manage the lifecycle of trace sessions and providers. The standard tool is logman.exe. |
| Providers | Components that generate events. There are over 1,000 built-in provider types, including MOF, WPP, Manifest-based, and TraceLogging. |
| Consumers & Channels | Consumers subscribe to events, which are organized and filtered through logical channels. |
| ETL Files | Event Trace Log files where data is stored on disk for long-term archiving and offline analysis. |
Some useful ETW providers mentioned in the module:
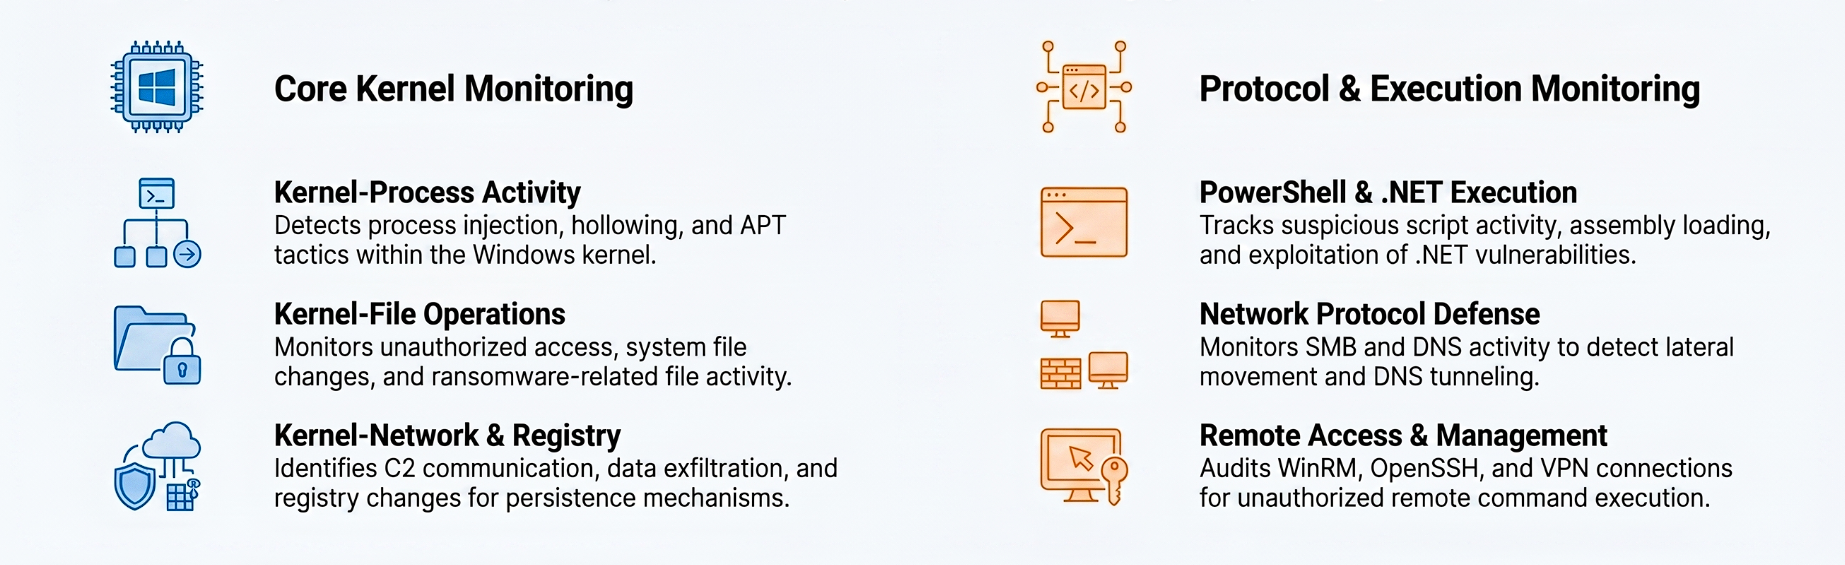
ETW monitoring areas for kernel activity and protocol/execution telemetry.
Some telemetry is so sensitive and powerful that Microsoft actively shields it from both standard users and potential attackers.
| Provider / Concept | Why It Matters |
|---|---|
| Microsoft-Windows-Threat-Intelligence | A highly restricted, high-value provider used by DFIR teams. It records granular data about sophisticated evasion tactics that may otherwise go undetected. |
| Protected Process Light (PPL) | Microsoft locks this provider behind PPL to prevent malware from tampering with or subscribing to it. Earning PPL status requires identity proof, legal agreements, Microsoft testing, and a special Authenticode signature through an ELAM driver. |
To harness ETW, analysts use the Publish-Subscribe architecture: Controllers manage sessions, Providers generate events, and Consumers read them, often saving them to .ETL files for offline analysis.
| Tool | Use |
|---|---|
logman.exe |
Built-in command-line controller. logman.exe query -ets reveals active trace sessions. It can also query specific providers to show GUIDs and keywords. |
| Performance Monitor | Built-in GUI tool for exploring and modifying trace sessions. |
| EtwExplorer | Community tool useful for viewing hidden metadata and XML structures of providers. |
Real-Time Monitoring vs Long-Term Storage
When implementing ETW or standard logging strategies, organizations must understand the difference between active monitoring and historical archiving.
| Strategy | Purpose |
|---|---|
| Real-Time Monitoring | ETW is lightweight enough for continuous monitoring when paired with centralized log management that can collect, parse, and trigger alerts quickly. |
| Durable Storage (ETL Files) | ETW can write events to .ETL files for long-term archiving, offline analysis, and deep forensic investigations. |
| Organizational Choice | Each organization must decide what to collect based on security objectives and performance cost. |
| Tuning the Environment | A threat in one environment may be normal in another, so monitoring must be tuned to the local baseline. |
Practical ETW Hunting with SilkETW
For practicality, a toolset I am keeping on my radar is SilkETW. It helps bridge some gaps left by standard monitoring tools.

Reference: SilkETW ETW collection wrapper (see References).
While ETW provides incredible telemetry, interacting with it natively can be complex. SilkETW acts as a user-friendly wrapper that collects ETW data, saves it to formats like JSON, and can even forward event logs into the standard Windows Event Viewer through SilkService for centralized visibility.
Detection Scenario 1: Defeating Parent PID Spoofing
Understanding normal parent-child process relationships is crucial. For example, calc.exe should never spawn cmd.exe. However, attackers know this and try to manipulate those relationships.
- The Attack (Parent PID Spoofing): Attackers spoof the parent process ID. For instance, code executed through
powershell.execan spoof process creation to make it look like a legitimate system service, such asspoolsv.exe, spawned a maliciouscmd.exe. - The Sysmon Blindspot: Sysmon Event ID
1is vulnerable to this technique and may incorrectly log the spoofed parent. - The SilkETW Solution: Capturing data from the
Microsoft-Windows-Kernel-ProcessETW provider can bypass spoofed metadata and identify the true creator of the process.
Detection Scenario 2: “Bring Your Own Land” (BYOL) Attacks
- The Evolution: Defenders became good at catching “Living off the Land” attacks, where attackers abuse native tools like PowerShell. In response, attackers pivoted to “Bring Your Own Land.”
- How BYOL Works: Instead of relying on native tools, attackers bring custom-built .NET assemblies, such as C# tools or payloads like Seatbelt, and execute them entirely in memory.
- Why Attackers Love .NET: It is installed by default on Windows. The CLR handles memory automatically, leaving fewer artifacts. It can execute purely in memory without dropping files to disk, and it provides built-in libraries for HTTP connections and cryptography. Cobalt Strike’s
execute-assemblycommand heavily relies on this. - The Sysmon Limitation: Sysmon Event ID
7can detect .NET attacks by watching for sudden loading of core .NET DLLs likeclr.dllandmscoree.dll. However, this is noisy and does not provide granular details about the actual content or payload of the loaded assembly.
Deep Inspection with the DotNETRuntime Provider
To get the full picture of an in-memory .NET attack, analysts can use SilkETW to tap into the Microsoft-Windows-DotNETRuntime ETW provider.
By using filters in SilkETW, such as keyword 0x2038, defenders can extract useful information, including actual method names being executed.
| Keyword | What It Captures |
|---|---|
| JitKeyword | Just-In-Time compilation events, exposing methods compiled at runtime. |
| InteropKeyword | When managed .NET code interacts with unmanaged code or native Windows APIs. |
| LoaderKeyword | Assembly loading details, showing what .NET payloads are loaded and executed. |
| NGenKeyword | Use of precompiled Native Image Generator assemblies, useful for catching attempts to evade JIT-based detection. |
Get-WinEvent Notes
The Get-WinEvent cmdlet is the main tool I used for deep, programmatic log analysis and threat hunting. I spent a good amount of time with it, so I made this table for myself to remember the important commands and parameters.
| Command / Parameter | Why It Matters |
|---|---|
Get-Help Get-WinEvent -Full |
Shows all parameters and capabilities available for the cmdlet. |
-ListLog |
Shows what logs exist on the machine. |
-ListProvider |
Reveals the sources actively writing to logs. |
-LogName |
Pulls events from a specified live log. |
-Path |
Reads offline .evtx files instead of live logs, which is essential for forensics. |
-MaxEvents |
Limits the number of events returned and speeds up query testing. |
-Oldest |
Controls chronological order by returning the oldest events first. |
Select-Object |
Filters columns and selects specific properties. |
Where-Object |
Filters rows after data is fetched, useful but slower for large logs. |
-FilterHashtable |
Filters common fields like ID, date, and level at the source before data is returned. |
| XML Parsing | Breaks the message into individual fields so specific data can be extracted. |
New-Object PSObject -Property @{} |
Builds custom objects with clean column names after extracting XML data. |
-FilterXPath / -FilterXml |
Advanced source filtering for deeply buried XML fields inside EventData. |
The simple rule for reference
Whenever I am building custom filters, especially for things like encoded PowerShell in Sysmon Event ID 1, I want to follow this three-step rule:
- Grab one single event.
- Look closely at its XML structure.
- Then build the specific filter.
Where AI Can Help
This module is where AI started to feel practically useful for me, not as a replacement for analysis, but as a way to move faster through the repetitive parts of log hunting.
For my own workflow, I built a Claude Skill and used NotebookLM connectors to give the model better context, especially around Microsoft documentation for Get-WinEvent, XML filtering, Sysmon fields, and event log structure. That helped me ask better questions and generate cleaner PowerShell query ideas during the Skill Assessment.
For hunters, this can be crucial. Query writing takes time, especially when dealing with large .evtx files, nested XML fields, and different Sysmon event IDs. If the model already has the right documentation and examples in context, it can help draft Get-WinEvent, FilterXPath, or XML parsing logic much faster.
But the important part is still verification. LLMs helped me when I had the right context, especially during the Skill Assessment, but I still had to inspect the XML and understand the fields myself. The model can help write the query, but I have to know whether the query is actually looking at the right field, event ID, timestamp, or process relationship and can be your best friend in times when you get stuck.
The practical AI workflow I want to keep using:
- Use official docs and notes as context.
- Ask AI to help draft the first query.
- Test the query manually.
- Inspect one raw event’s XML.
- Correct the query based on the real fields.
- Use AI again to clean or extend the query once the logic is proven . Can take many iterations but helpful enough.
That balance matters. AI speeds up the hunting workflow, but the analyst still owns the evidence.
References
[HTB Academy] Certified Defensive Security Analyst (CDSA) - Module 3: Windows Event Logs & Finding Evil. https://academy.hackthebox.com/
[HTB-CDSA] Sysmon threat detection scripts and XML queries for CDSA Module 3. https://github.com/kismatkunwar89/HTB-CDSA
[SBousseaden] Common Windows Normal Processes Parent/Child Relationships (process tree mind map). https://twitter.com/SBousseaden
[SwiftOnSecurity] sysmon-config (Sysmon configuration baseline). https://github.com/SwiftOnSecurity/sysmon-config
[Cyberdom] Microsoft Sentinel and Sysmon 4 Blue Teamers. https://cyberdom.blog/microsoft-sentinel-and-sysmon-4-blue-teamers/
[Wietze Beukema] Hijacking DLLs in Windows. https://www.wietzebeukema.nl/blog/hijacking-dlls-in-windows
[Microsoft] Get-WinEvent (PowerShell cmdlet documentation). https://learn.microsoft.com/en-us/powershell/module/microsoft.powershell.diagnostics/get-winevent
[Microsoft] About Event Tracing (ETW overview). https://learn.microsoft.com/en-us/windows/win32/etw/about-event-tracing
[FireEye] SilkETW (ETW collection wrapper). https://github.com/fireeye/SilkETW
[EtwExplorer] ETW provider metadata explorer. https://github.com/zodiacon/EtwExplorer
Skill Assessment
Since the skill assessment notes are much longer and more command-heavy, I kept them separate from this page. The Key Takeaway, full .evtx investigation walkthrough, and all six questions are here: Module 3: Skill Assessment